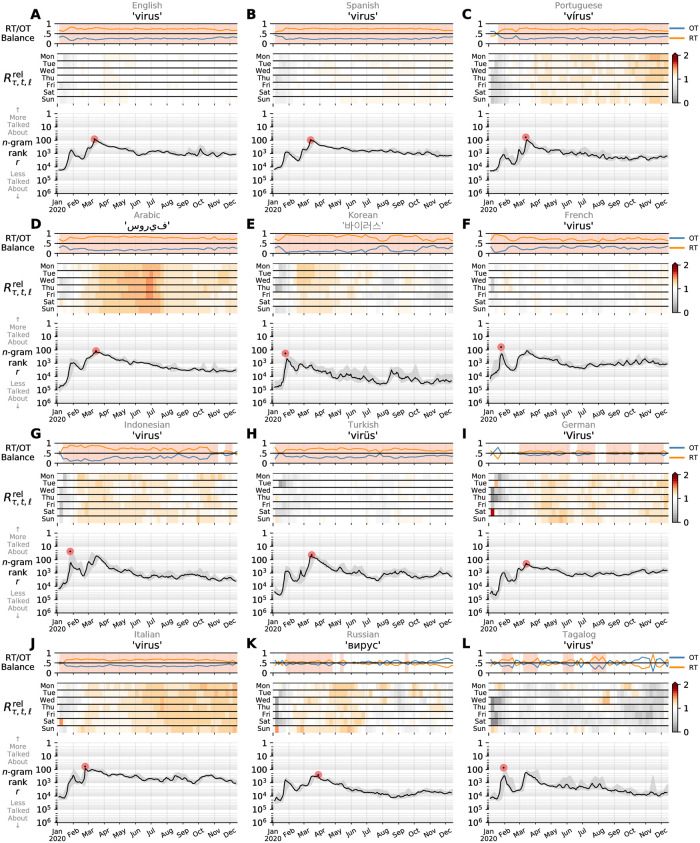
Fig 4. Contagiograms for the word ‘virus’ in the top 12 of the 24 languages we study here.
The major observation is that the world’s attention peaked early in late January around the news of an outbreak of a new infectious disease in Wuhan, declining through well into February before waking back up. The main plots in each panel show usage ranks at the day scale (ET). The solid lines indicating smoothing with a one week average (centered). The plots along the top of each panel show the relative fractions of each 1-gram’s daily counts indicating as to whether they appear in retweets (RT, spreading) or organic tweets (OT, new material). The background shading shows when the balance favors spreading—story contagion. See Fig 5 for the next 12 languages, as well as Sec. Results and discussion for general discussion, and Alshaabi et al. [29] for technical details of contagiograms.

