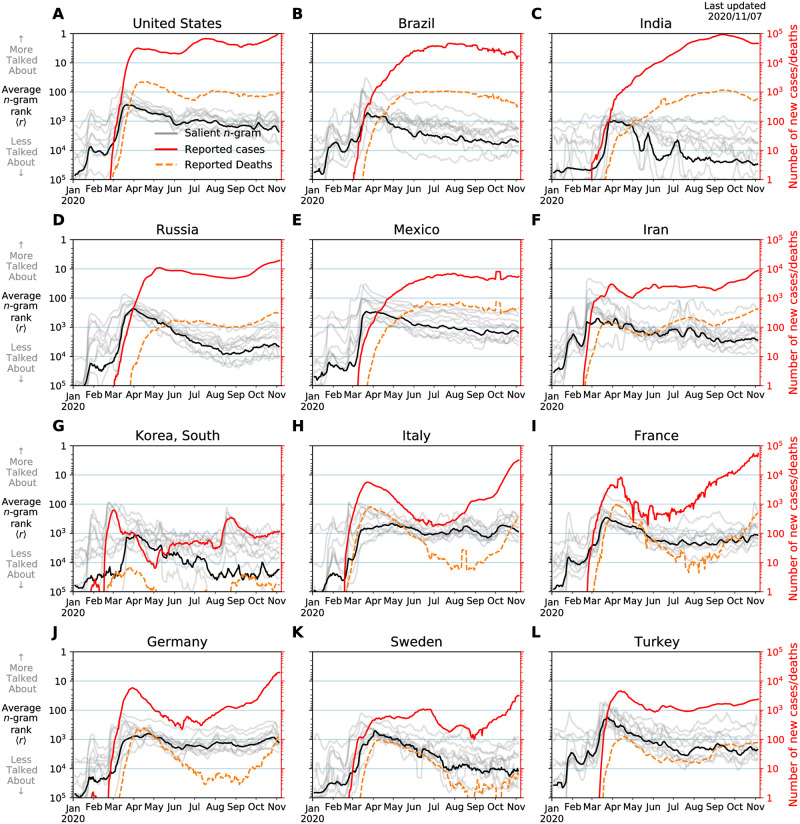
Fig 6. Time series for daily reported case loads and death compared with a list of 10 salient 1-grams for the top language spoken in each country.
For each n-gram, we display a weekly rolling average of usage ranks at the day scale in gray overlaid by an average of all these 1-grams in black marking their corresponding ranks using the left vertical axis. Similarly, we use the right vertical axis to display a weekly rolling average of daily new cases (red solid-line), and reported new deaths (orange dashed-line). We note that the reported counts are underestimates, more so for cases than deaths, and errors are unknown. We sourced data for confirmed cases and fatalities from Johns Hopkins University Center for Systems Science and Engineering’s COVID-19 project [12]. Starting on 2020/01/22, the project’s data has been collected from national and regional health authorities across the world. The data is augmented by case reports from medical associations and social media posts—these later sources are validated against official records before publication. For the present piece, we use daily summary files for case counts and fatalities, although an API and online dashboard are available for more up-to-date reports.

