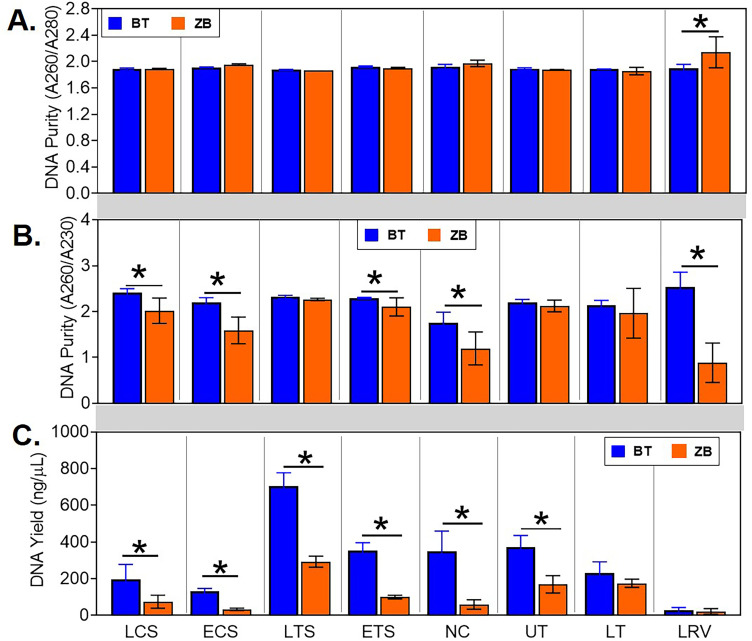
Fig 2. Comparison of quantity and quality of DNA from samples extracted using the ZB and BT kits.
The elution volume was standardized to 50 μL for both kits. DNA quality was expressed as ratios of absorbances at (A) 260nm and 280nm wavelengths (A260/A280) and (B) 260nm and 230nm wavelengths (A260/A230). (C) DNA yield was expressed as mass per unit volume (ng/μL). Statistical differences, * p < 0.05 (pairwise Kruskal-Wallis tests, with a Benjamini-Hochberg correction for false discovery). LCS, live choanal swab; ECS, euthanized choanal swab; LTS, live tracheal swab; ETS, euthanized tracheal swab; NC, nasal cavity wash; UT, upper trachea wash; LT, lower trachea wash; LRV, lower respiratory lavage.

