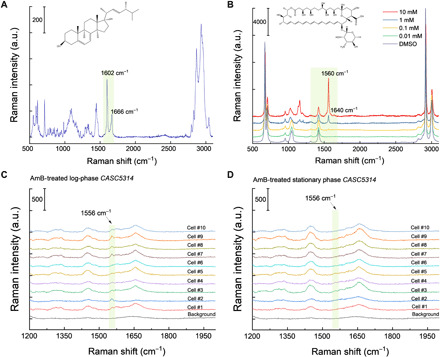
Fig. 2. Raman spectra of ergosterol, AmB, and AmB-treated single log-phase and stationary-phase CASC5314 cells.

(A and B) Raman spectra of pure ergosterol (A) and AmB (B) dissolved in DMSO at a series of concentrations, respectively. a.u., arbitrary unit. (C) Raman spectra of AmB-treated single log-phase CASC5314 cells. (D) Raman spectra of AmB-treated single stationary-phase CASC5314 cells. Regions of interest are highlighted by green boxes.
