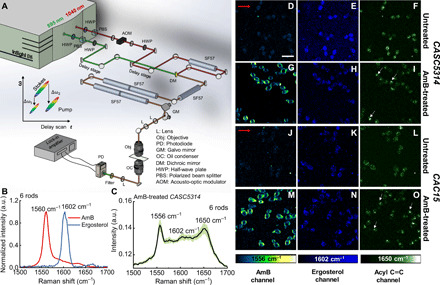
Fig. 3. SRS microscope, performance characterization, and SRS imaging of untreated CASC5314 and CAC15 at 1556, 1602, and 1650 cm−1.

(A) Schematic of the laboratory-built polarization-sensitive SRS microscope. Two half-wave plates (HWPs) were used to control the polarization of each beam. (B) SRS spectra of AmB (10 mg/ml) and pure ergosterol, with optimal Raman peaks highlighted. Data acquired under six-rod chirping. (C) SRS spectra of single AmB-treated CASC5314 cells. Data: means ± SD from at least 10 yeasts. AmB: 3.2 μg/ml for 1 hour. Data acquired under six-rod chirping condition. (D to F) SRS images of untreated CASC5314 cells at 1556, 1602, and 1650 cm−1, respectively. (G to I) SRS images of AmB-treated CASC5314 cells at 1556, 1602, and 1650 cm−1, respectively. (J to L) SRS images of untreated CAC15 cells at 1556, 1602, and 1650 cm−1, respectively. (M to O) SRS images of AmB-treated CAC15 cells at 1556, 1602, and 1650 cm−1, respectively. Pixel dwell time: 50 μs. Scale bar, 10 μm. Laser polarization direction is indicated by red arrows. Lipid droplet is indicated by white arrows.
