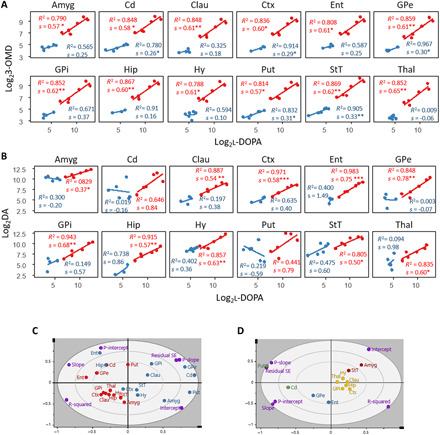
Fig. 4. Correlation of l-DOPA to 3-OMD or DA in non-LID and LID.

(A) LR of the change in 3-OMD content in response to l-DOPA. (B) LR of the change in DA content in response to l-DOPA. (A and B) Blue, non-LID; red, LID. A significant linear relationship is indicated with *P < 0.05, **P < 0.005, and ***P < 0.001. For all linear models, n = 6 in the LID group, and Cd, Hy, Put, and StT in the non-LID group. For the remaining non-LID regions, n = 5 in Amyg and Thal, n = 4 in Clau, Ctx, GPe, and GPi, n = 3 in Hip in both correlations, n = 4 in Ent in l-DOPA to 3-OMD, and n = 3 in Ent in l-DOPA to DA. (C) PCA model computed from results of LR models in (B); blue, non-LID; red, LID; purple, loadings. (D) PCA model computed from results of LR analysis for change in DA in response to increased l-DOPA in LID only. Regions are color-coded according to hierarchical clustering and grouping structures that respond similarly to changes in l-DOPA content. P-intercept, P value for intercept; P-slope, P value for slope; R-squared, R2; Residual SE, SE of residuals.
