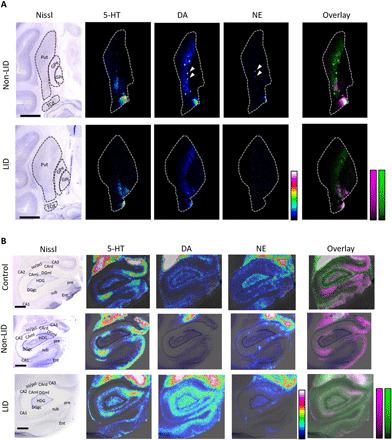
Fig. 6. Comparison of 5-HT, DA, and NE localization in basal ganglia and hippocampus.

(A) Nissl-stained section showing basal ganglia structures at −6 mm ac and MALDI-MS images of 5-HT (scaled to 0 to 25%), DA (scaled 0 to 30%), and NE (scaled to 0 to 40%) in non-LID and LID. Lateral resolution, 50 μm. Scale bars, 5 mm. White arrows indicate DA and NE patches that colocalize. (B) Nissl-stained section of Hip at −4 mm ac and MALDI-MS images of 5-HT, DA, and NE (all scaled to 0 to 20%) in control, non-LID, and LID macaque brain. Lateral resolution, 80 μm. Scale bars, 2 mm. For (A) and (B), images are RMS-normalized and log-transformed, and overlays show DA in green and 5-HT in magenta. CA, Cornu ammonis; CAml, molecular layer of the Hip; CArd, stratum radiatum; DGgc, granular layer of the dentate gyrus; DGml, molecular layer of the dentate gyrus; HDG, hilus of the dentate gyrus; so, stratum oriens; pcl, pyramidal cell layer; pre, presubiculum; sub, subiculum; TCd, tail of caudate nucleus.
