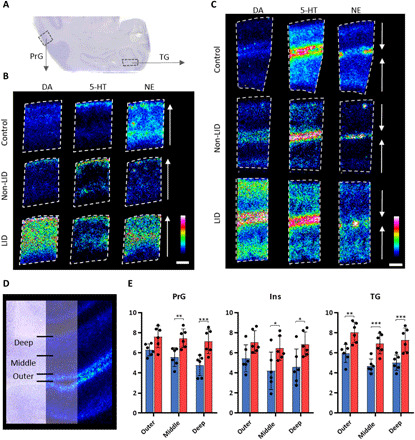
Fig. 7. Mapping of DA throughout cortical areas and layers.

(A) Nissl-stained coronal tissue section at −4 mm ac illustrating the location of the analyzed cortical area. (B) MS images of DA, 5-HT, and NE in PrG and (C) TG at −4 mm ac. Color intensity scale is 0 to 50% for DA and 5-HT and 0 to 30% for NE. Lateral resolution, 50 μm; scale bar, 1 mm; images are RMS-normalized. The arrows in (B) and (C) show the orientation of the sample pointing toward the outer layers of the cortex. (D) Nissl-stained cortex section overlaid with DA distribution illustrating the three layers of the cortex that were analyzed. (E) Relative quantitation of DA in outer, middle, and deep cortical layers at −4 mm ac in the PrG, Ins, and TG. Bars show means, and error bars show SDs; blue, non-LID; red, LID. Statistics were performed using a two-way ANOVA and a post hoc Sidak’s multiple comparisons test (n = 6 for both groups in all cortical layers). *P < 0.05; **P < 0.01; ***P < 0.001. Two-way ANOVA results are summarized in table S5.
