
Fig. 4. Trajectories of chemical depletion and isotopic fractionation in the evaporation (left) and condensation (right) stages considered to explain the composition of group II CAIs (see text and the Supplementary Materials for details).
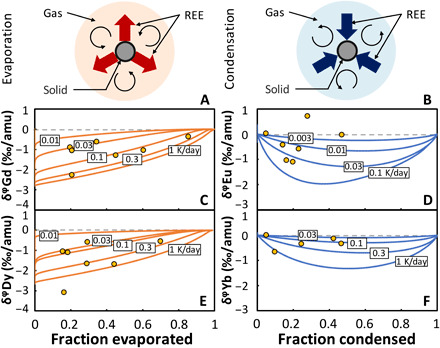
Schematics of the models envisioned for evaporation (A) and condensation (B). (C) Gd and (E) Dy isotopic fractionations and depletions during closed-system evaporation for different heating rates. (D) Eu and (F) Yb isotopic fractionations and depletions during closed-system condensation for different cooling rates. The labels on the curves are the heating rates (evaporation) and cooling rates (condensation) used in the calculations.