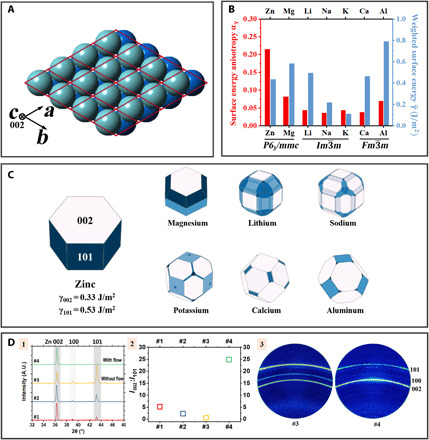
Fig. 5. Crystallographic characteristics of zinc.

(A) Crystal model of HCP Zn metal. The red lattice denotes the primitive unit cells. The front, light blue layer and the back, dark blue layer are two close-packed layers that stack periodically (…ABABAB…) along the [002] direction (also called the c axis). (B) Weighted surface energy and surface energy anisotropy αγ of representative anode metals., where γhkl is the surface energy of (hkl), and is the area fraction of the (hkl) family in the Wulff shape. . αγ can be viewed as a normalized coefficient of variation of surface energy. A greater αγ value implies a larger anisotropy in the surface energies of the crystal facets exposed in its Wulff shape. In an extreme case of a perfectly isotropic crystal, αγ = 0. Plotted according to data reported in (125). (C) Wulff shapes for metals of contemporary interest as battery anode materials. They depict the shape of the crystals at thermodynamic equilibrium. Adapted with permission using the database reported in (125). (D) XRD analysis of the crystallographic texturing of Zn metal electrodeposits. (D-1) θ−2θ XRD line scans of Zn electrodeposits. (D-2) Peak intensity ratio I002:I101 of the scans shown in Fig. 5D-1. (D-3) 2D XRD of samples #3 and #4 shown in Fig. 5D-1. Adapted with permission from (28). A.U., arbitrary units.
