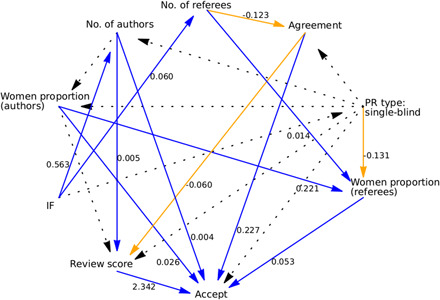
Fig. 2. Learned structure of the Bayesian network.

For the sake of readability, we did not report the scientific field effect, which was linked to all nodes. Orange arrows indicate a negative relationship, and blue arrows indicate a positive relationship (dotted black, if the sign depends on the scientific field taken into consideration). Path coefficients are only shown for paths that were consistent across scientific fields. All path coefficients can be found in table S9.
