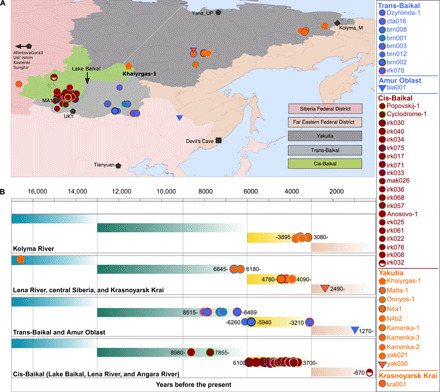
Fig. 1. Geographical and chronological information concerning the ancient individuals.

(A) Geographical map showing the locations of the individuals sequenced in this study (orange, blue, and red). Genomes published elsewhere are shown as black (see table S2 for information about all published individuals used in comparative analysis). (B) Timeline showing the ages of the ancient individuals as calibrated years before the present.
