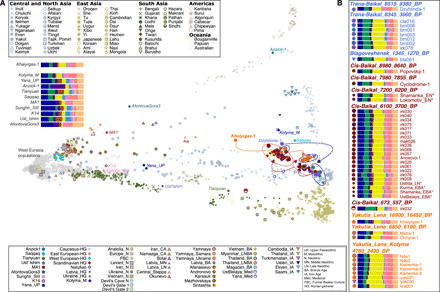
Fig. 2. PCA and ADMIXTURE analysis.

(A) PCA calculated using a set of world populations. Ancient individuals were projected onto the inferred PC space (see table S2 for information about individuals). Arrows indicate the direction of population changes in time. Asterisk denotes being published in (16). (B) A subset of ADMIXTURE result for K = 14 clusters showing the ancestral composition of investigated ancient individuals.
