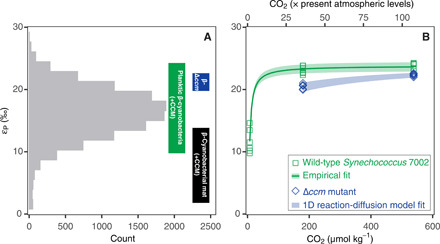
Fig. 2. Middle Proterozoic εP estimates as compared to empirical cyanobacterial εP values.

(A) Histogram of estimated εP values between 1.0 and 1.8 Ga. Boxed vertical ranges represents εP values from a cyanobacterial mat system [black (26)] and εP values reported here in cultures of WT (green) and Δccm mutant (blue) Synechococcus sp. PCC 7002 strains. (B) Measured values of εP increase at higher dissolved CO2 levels in cultures of Synechococcus sp. PCC 7002. In the WT strain (green squares), εP values covary with [CO2(aq)]−1 (green line, fig. S5; R2, 0.96). Blue diamonds are experimental results for the Δccm mutant, which requires ≥36 × PAL CO2 to grow under our experimental conditions. The shaded blue band represents calculations from a 1D reaction-diffusion model trained on physiological observations of the Δccm mutant. Horizontal axes refer to CO2 in the culture headspace relative to PAL (1 PAL = 280 ppm CO2; upper axis) and the corresponding dissolved CO2 in the culture medium (micromole per kilogram; lower axis). Data points represent biological replicates (n = 6 for each condition).
