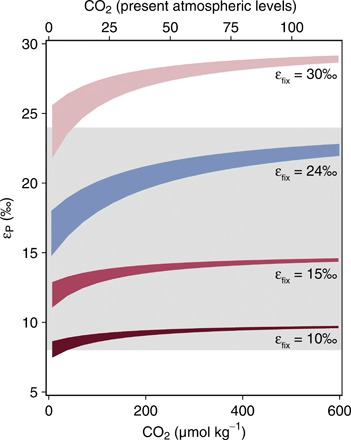
Fig. 3. Modeled relationships between εP and CO2 concentration for β-cyanobacteria without a CCM incorporating estimated middle Proterozoic O2 levels [0.1 to 10% PAL (8)].

The gray band represents the estimated middle Proterozoic distribution of εP values (95th percentile; 8 to 24‰). The blue field represents calculations extending the observed fractionation by the Δccm mutant across possible Proterozoic CO2 and O2 levels. The red fields represent calculations incorporating the measured kinetics of ancestral form 1B rubisco (table S3) (42) and the full range of known intrinsic isotope effects for rubisco (εfix = 10, 15, and 30‰; the SM).
