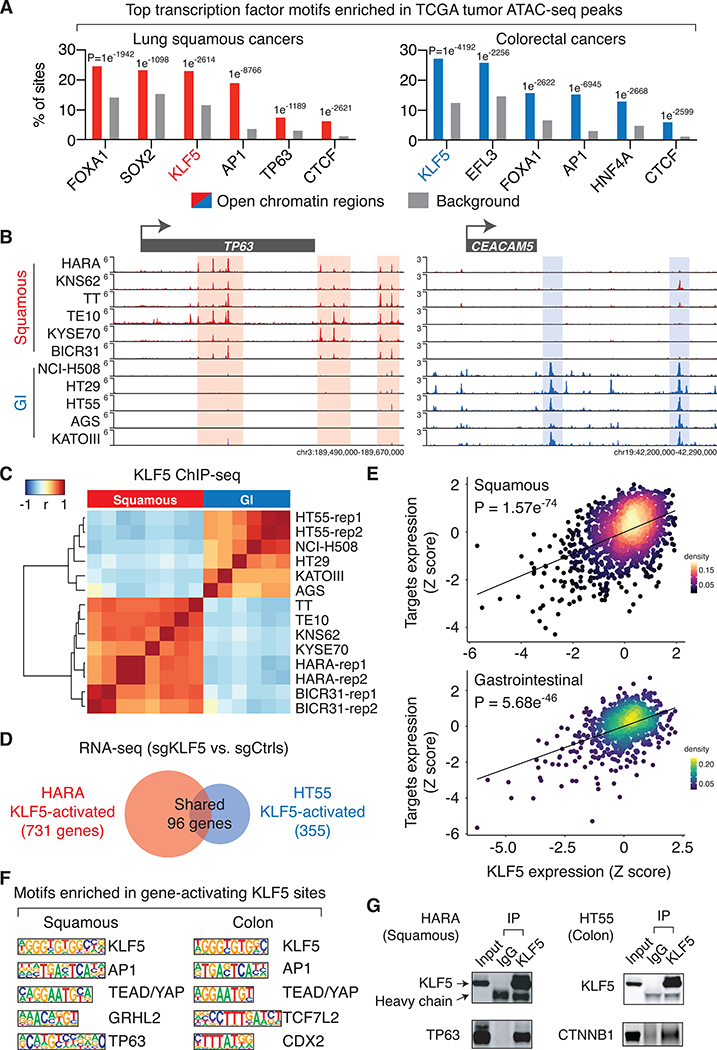
Figure 2: KLF5 drives lineage-specific transcription programs in cancer cells.
A. Top transcription factor binding motifs that are significantly enriched in chromatin accessible regions identified in the TCGA ATAC-seq datasets. The listed motifs are ranked based on their presence in the percentage of chromatin accessible regions.
B. KLF5 ChIP-seq intensity, Signal Per Million Reads (SPMR)/bp, in the TP63 and CEACAM5 loci.
C. Unsupervised clustering of cancer cell lines based on the correlation of KLF5 binding intensity across the most variable 1000 KLF5 binding sites. ChIP-seq biological replicates were performed for HARA, HT55 and BICR31 cells (rep1 and 2).
D. Comparison of genes that are activated by KLF5 (based on RNA-seq results with and without KLF5 knockout) in the lung squamous cancer cell line HARA and the colorectal cancer cell line HT55.
E. Gene expression correlation between the KLF5 gene and KLF5-target genes. For each cell line, Z-scores are assigned based on the expression level of the KLF5 gene (x-axis) or the average expression level of KLF5-target genes (y-axis).
F. Top transcription factor binding motifs enriched in KLF5 binding sites that are within −/+ 50kb of transcription start sites of KLF5-activated genes.
G. Immunoprecipitation using antibodies recognizing the endogenous KLF5 or IgG, followed by immunoblotting of TP63 in HARA cells, and CTNNB1 in HT55 cells.

