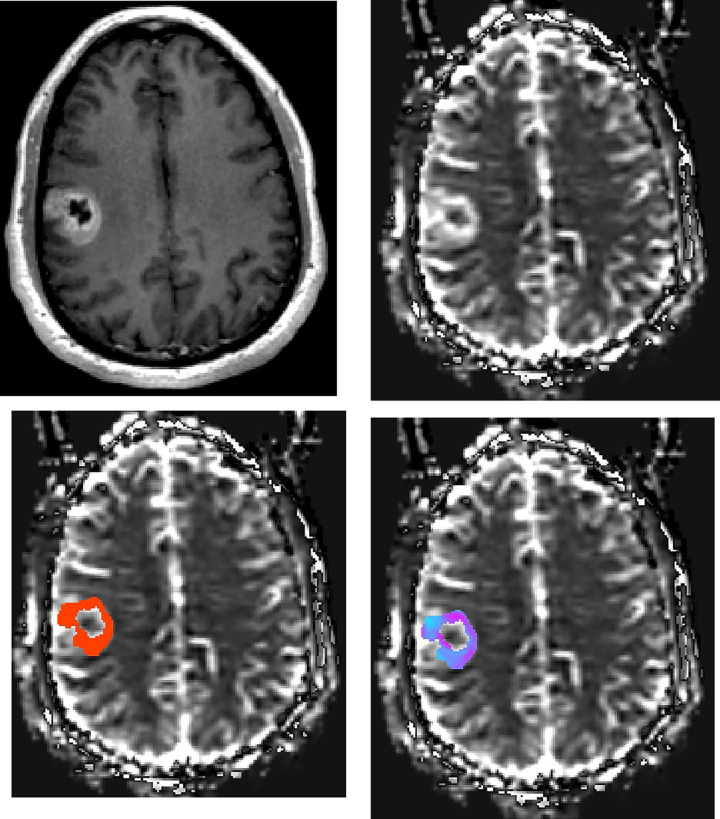
Fig 1. Patient with GBM.
Axial (a) contrast-enhanced T1-weighted image shows the right frontal GBM. rCBV maps at the same axial level show (b) lesion with high perfusion in solid component, (c) manually drawn region of interest including contrast-enhanced tumor avoiding any cystic necrotic part to measure rCBV, and (d) standard deviation (SD) map of rCBV reflecting the variation of lesion rCBV. The variety of colors in SD map (d) represent the differences in rCBV values, where pink represents a higher value and blue represents a lower value.

