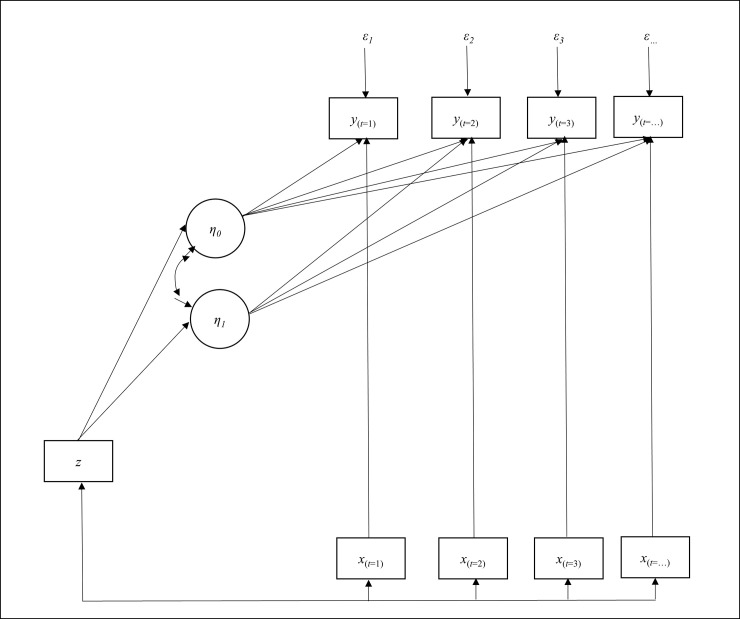
Fig 1. Statistical framework of latent growth-curve model.
y represents the time-varying dependent variable such as daily activity, steps, active minutes, and activity calories; x represents the time-varying covariate among social, environmental, and behavioral factors that change on a daily basis; z represents the time-constant covariate among personal and cognitive factors that are stable over time; and η0 and η1 represent the latent variables for the intercept and linear slope of the dependent variable y, respectively.

