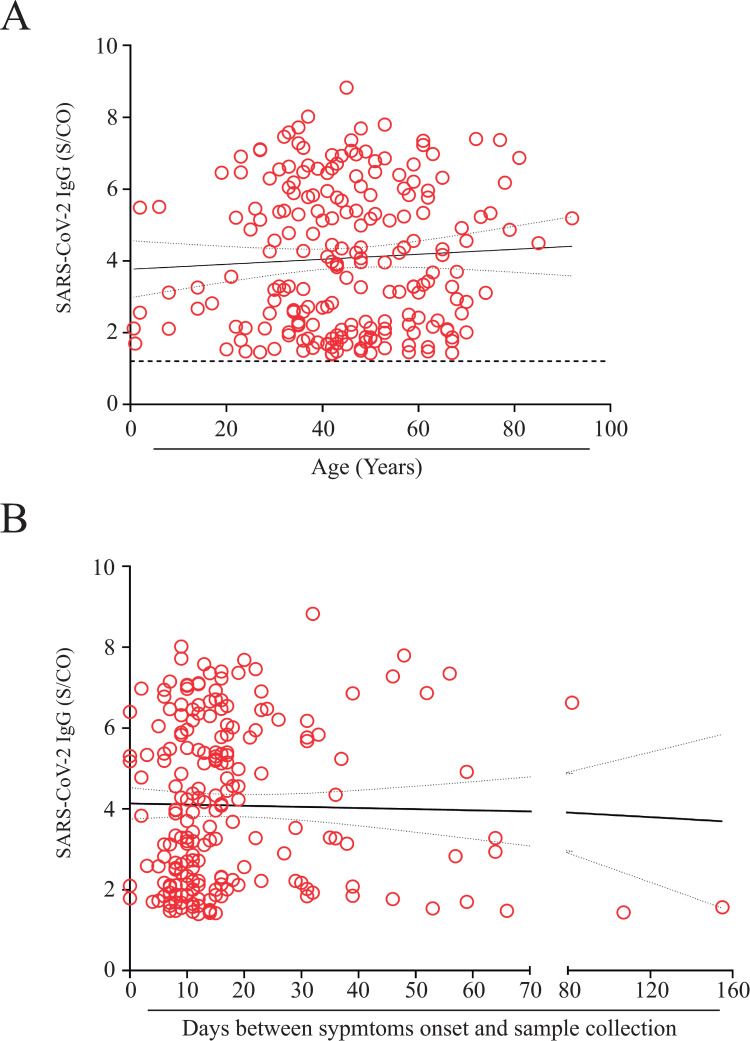
Fig 3.
Correlation between SARS-CoV-2 IgG immunoreactivity index (S/CO), and both: A) age distribution (years). The black dotted line represents the cutoff point for the CMIA (S/CO = 1.4). B) time between symptoms onset and sample collection. No significant differences were observed. Rho (ᴩ) = 0.019 (Fig 3A) and 0.1111 (Fig 3B).

