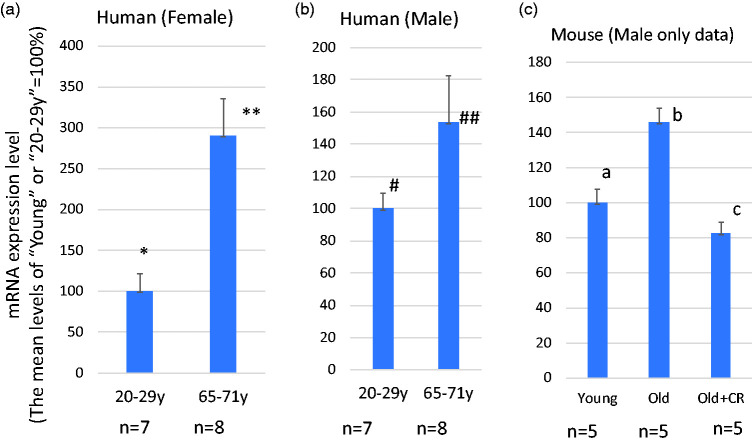
Figure 2.
The levels of SH3BP5 gene expression increase by aging. (a and b) SH3BP5 mRNA expression in young and old females (a) and males (b). The increase of SH3BP5 expression is statistically significant in the female group (* vs.**P < 0.005) with a trend towards significance between older and young males (# vs. ##P = 0.129). These data were obtained from the Gene Ontology Database (National Institute of Health (NIH)), ID=GDS472:201810_s_at and ID=GDS472:201811_x_at). (c) The effect of calorie restriction on SH3BP5 mRNA expression in mouse skeletal muscle. Data were obtained from C57B6 male mice, ages 5 months (young) and 25 months (old). Mice were fed a normal or calorie restricted (CR) diet (details are described in BMC Genomics 2007 Mar 23;8:80. PMID: 17381838). These data were obtained from the Gene Ontology Database (National Institute of Health (NIH)), ID= GDS2612/1421923_at). a vs. b: P < 0.003, b vs. c: P < 0.0003, a vs. c: P = 0.269. (A color version of this figure is available in the online journal.)

