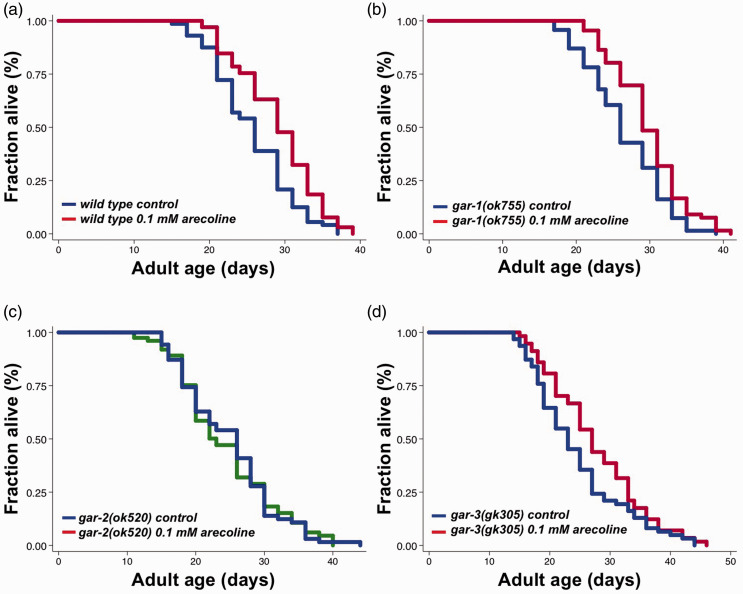
Figure 3.
gar-2 is required in lifespan extension induced by arecoline. Survival curves of (a) wild type animals subjected to control (blue) and 0.1 mM arecoline (red) treatment from adult Day 4 to Day 6, P = 0.0005. (b) gar-1(ok755) mutants subjected to control (blue) and 0.1 mM arecoline (red) treatment from adult Day 4 to Day 6, P = 0.0009. (c) gar-2(ok520) mutants subjected to control (blue) and 0.1 mM arecoline (green) treatment from adult Day 4 to Day 6, P = 0.9372. (d) gar-3(gk305) mutants subjected to control (blue) and 0.1 mM arecoline (red) treatment from adult Day 4 to Day 6, P = 0.0227. P-values represent results of log-rank. The graphs are representative of two or three independent experiments. See Table S1 for statistical analysis and additional repeats.

