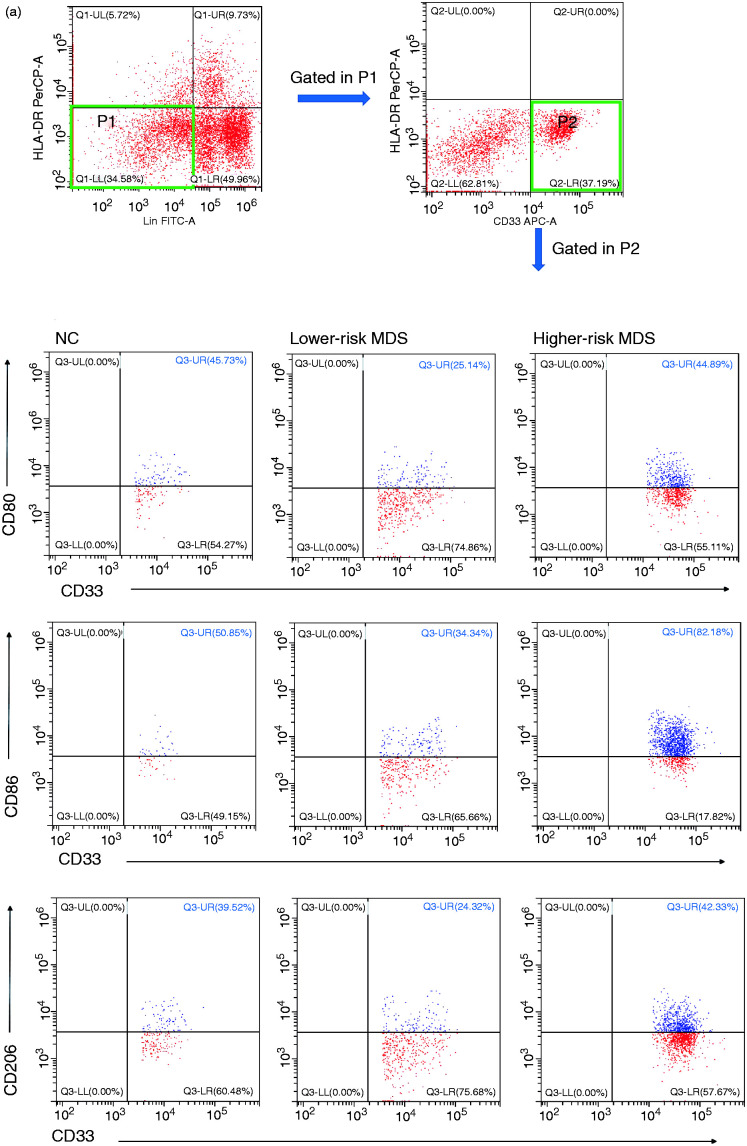
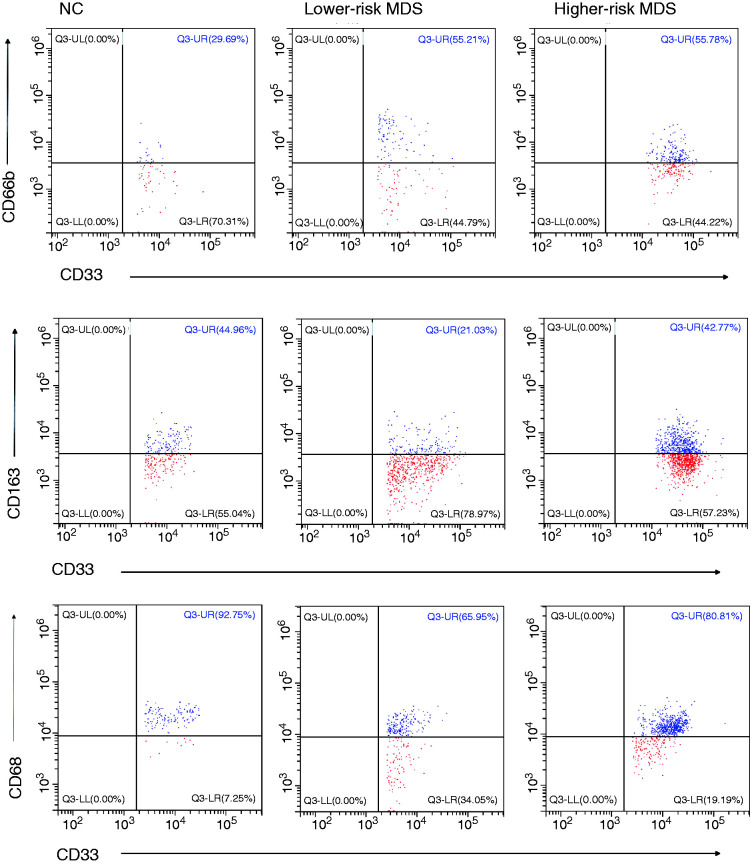
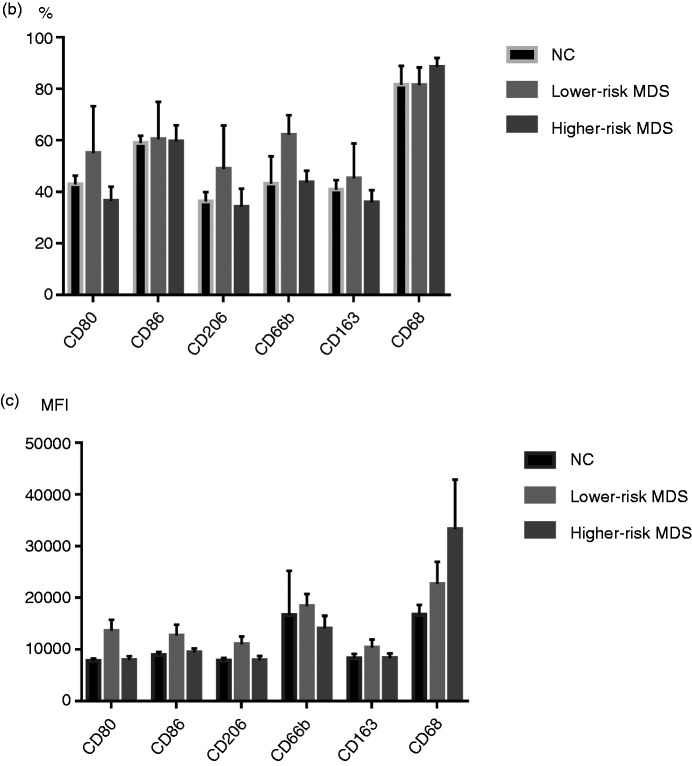
Figure 1.
(a) Representative flow cytometer scatter diagrams of the proportion of CD80, CD86, CD206, CD66b, CD163 and CD68 in MDSCs from lower-risk MDS, higher-risk MDS and NCs. The cells in the P2 green rectangle were Lin– HLA-DR– CD33+ cells (MDSCs), and the upper-right quadrant represented the percentage of CD80, CD86, CD206, CD66b, CD163 and CD68 in MDSCs. (b) The histogram represents the percentage of CD80, CD86, CD206, CD66b, CD163 and CD68 in MDSCs. (c) The histogram represents the MFI of CD80, CD86, CD206, CD66b, CD163 and CD68 in MDSCs. MDSC: myeloid-derived suppressor cells; MDS: myelodysplastic syndromes; NC: normal controls; MFI: mean fluorescence intensity.


