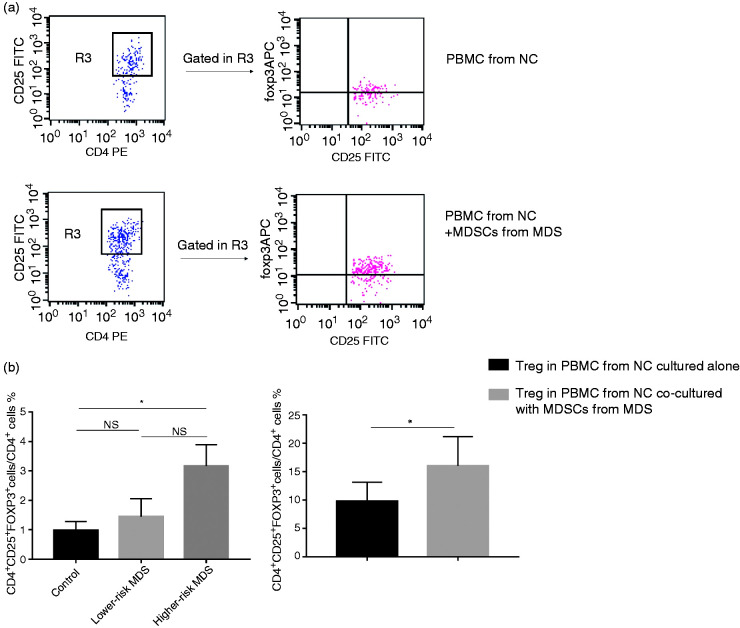
Figure 5.
Percentage of Tregs (CD4+CD25+Foxp3+ cells) in CD4+ T cells from NCs in vitro. PBMC were cultured with 10% FBS (containing 1 µg/ml anti-CD3 and 1 µg/ml anti-CD28). (a) Representative flow cytometer scatter diagrams of the proportion of Tregs in CD4+ T cells were shown in PBMC from NC cultured alone, and PBMC from NC co-cultured with MDSCs from MDS. The rectangle R3 presents the percentage of CD4+CD25+ T cells in CD4+ T cells, and the upper-right quadrant represent the percentage of CD25+Foxp3+ cells in CD4+CD25+ T cells. (b) The histogram represents the percentage of CD4+CD25+Foxp3+ cells in CD4+ T cells from NCs, lower-risk MDS and higher-risk MDS. (c) The histogram represents the percentage of CD4+CD25+Foxp3+ cells in CD4+ T cells from PBMC from NCs cultured alone and PBMCs from NCs co-cultured with MDSCs from MDS. *P < 0.05. Treg: regulatory T cells.

