Fig. 5.
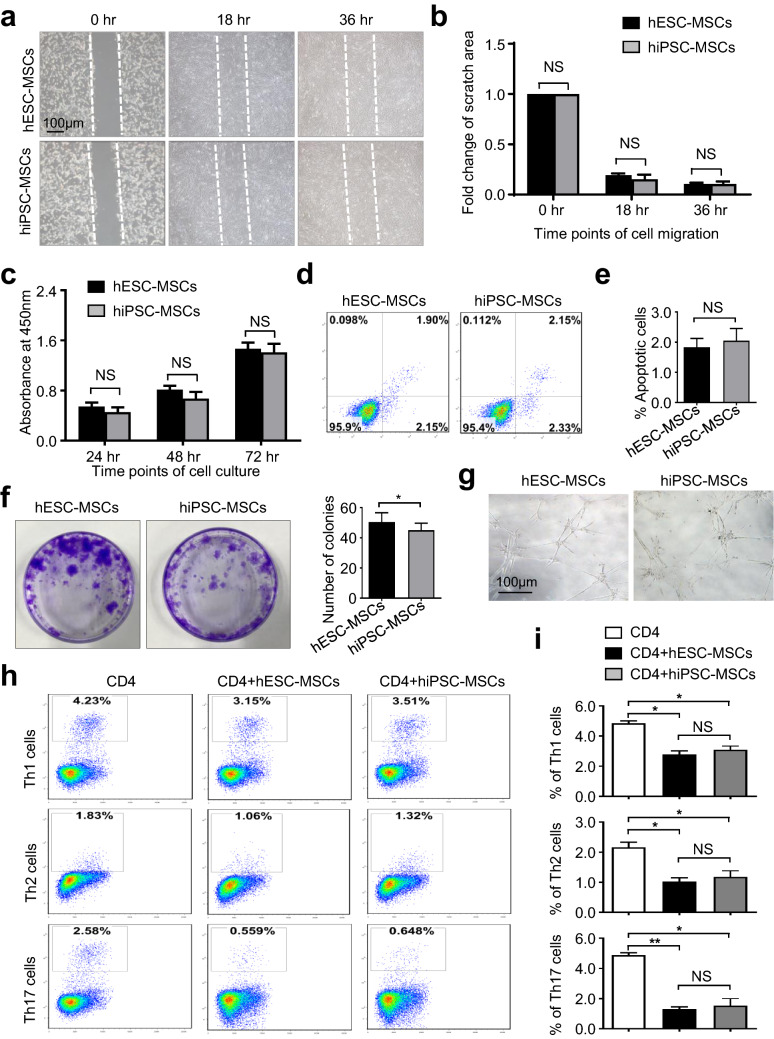
hPSC-MSCs exhibited consistently multifaceted cell vitality and immunoregulatory attributes. a, b Representative phase contrast images (a) and statistical analysis (b) of cell migration upon hPSC-MSC. Scale bar = 100 μm. c CCK-8 analysis of hPSC-MSCs during cell culture. d, e The percentages of apoptotic population in hPSC-MSCs were shown by the FCM diagram (d) and statistical analysis (mean ± SEM, N = 3) (e). f CFU-F analysis of the seeded hPSC-MSCs. g Microtubule formation assay of total tube number and length by hPSC-MSCs. h, i FCM analysis and statistical analysis of the differentiated Th1, Th2 and Th17 cells. All data were shown as mean ± SEM (N = 3). *P < 0.05, **P < 0.01; NS, not significant

