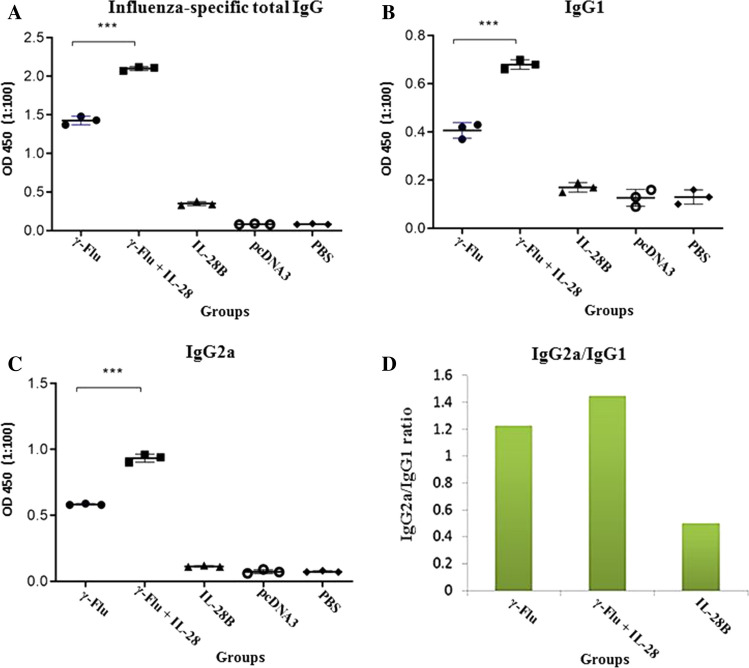
Fig. 3.
Levels of anti-influenza-virus antibodies in mouse sera one week after the last immunization. (A) Total IgG titers. (B) IgG1 titers. (C) IgG2a titers. (D) IgG2a/IgG1 ratio. Values for individual sera are expressed at 450 nm in each group (n = 3). Differences between mice immunized with γ-Flu+IL-28B plasmid and γ-Flu alone were statistically highly significant according to one-way ANOVA results (***, p < 0.001). The graphs also illustrate that the levels of influenza-virus-specific antibodies in all vaccinated and control groups differed considerably (p < 0.001).

