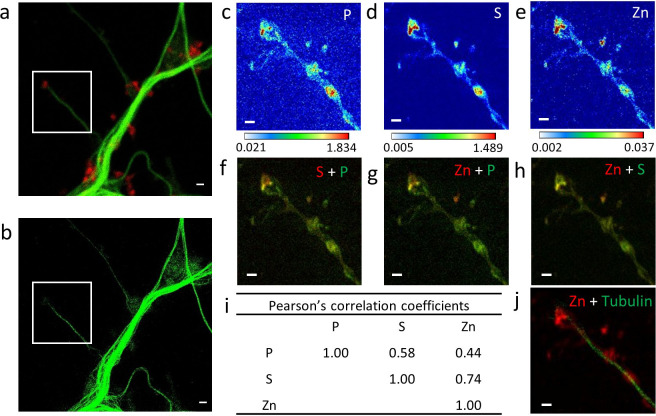
Figure 4. Correlative imaging in dendrites and spines.
(a) Confocal image of SiR-tubulin (green) and SiR700-actin (red). (b) STED image of SiR-tubulin (green) for the same zone as in (a). (c-e) SXRF element maps (P, S, Zn) from the region of interest framed in (a) and (b). (f) Overlay image of phosphorus (green) and sufur (red). (g) Overlay image of phosphorus (green) and zinc (red). (h) Overlay image of sulfur (green) and zinc (red). (i) Pearson’s correlation coefficients for the elements (P, S, Zn) in the roi. (j) Overlay image of STED SiR-tubulin (green) and zinc (red). Scale bars: 500 nm, except for (a) and (b) 1 µm. Color scales min-max values in ng.mm−2.


