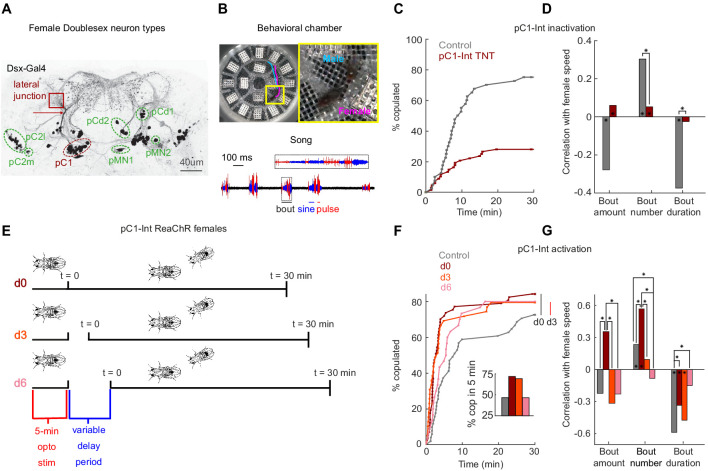
Figure 1. pC1-Int activation has a persistent effect on female receptivity and responses to male courtship song.
(A) Dsx+ neurons in the female central brain. Max z-projection of a confocal stack in which Dsx+ cells are labeled with GFP (adapted from Deutsch et al., 2019). Dsx is expressed in eight morphologically distinct cell types in the female brain (seven types are indicated by circling of their somas; the more anterior cell type aDN [Lee et al., 2002] is not shown). pCd has two morphologically distinct types, pCd1 and pCd2 (Kimura et al., 2015). Many of these cells project to a brain region known as the lateral junction (red square). pC1 cells project to the lateral junction through a thin bundle (red arrow). This bundle was used to identify these cells in the EM dataset (see Figure 3—figure supplement 1). (B) Behavioral chamber (diameter ~25 mm) tiled with 16 microphones to record song. Male and female positions were tracked (a 1.5 s example trace is shown for the male (cyan) and female (magenta)), and male song was automatically segmented into sine and pulse (below). (C) Percent of male/female pairs that copulated as a function of time. Cox proportional hazards regression p=6.3*10−6: pC1-Int TNT (red, n = 68 pairs) compared with controls (gray, n = 40 pairs). (D) Rank correlation between male song (bout amount, number and duration) and female speed for pC1-TNT females (dark red) or control females (gray) paired with wild-type males. Significance between experimental groups was measured using ANOCOVA and multiple comparison correction (*p<0.01). An asterisk on a bar indicates a significant correlation between a single male song measure and female speed (*p<0.01). (E) Experimental design for pC1-Int activation. pC1-Int cells were activated (using ReaChR) for 5 min in a solitary female placed in the behavioral chamber. Following light offset, a wild-type male was introduced at t = 0, following a variable delay period (d0 = no delay; d3 = 3 min delay; d6 = 6 min delay). All behavioral phenotypes were measured at t > 0. (F) Same as (C), but for females expressing ReachR in pC1-Int cells according to the protocol shown in (E). Inset: The percent of pairs copulated between t = 0 and t = 5 min for each condition. pC1-Int activated females in the d0 condition (n = 57) copulated significantly faster than controls (n = 51; vertical black line; p=0.0045, Cox’s proportional hazards regression model, accounting for censoring, as not all flies copulated in 30 min; black vertical line). Time to copulation was also shorter in the d3 group (n = 39 pairs) compared with controls (d0, no ATR), but the difference was not significant after Bonferroni correction (p=0.034; red vertical line), and no significant difference was found between the 6 min delay (n = 30) and control groups (p=0.21). (G) Same as (D), but for females expressing ReachR in pC1-Int cells according to the protocol shown in (E). Asterisks show significance, using the same criteria as in (D). Numbers of pairs are the same as in (F).


