. 2020 Nov 23;9:e59502. doi: 10.7554/eLife.59502

Figure 2. Automated identification of persistent female behaviors following pC1-Int activation.

(A) For each video frame, 17 parameters were extracted based on tracking of male/female position and heading (see Materials and methods for parameter definition). An example trace (30 s) is shown for each parameter. (B) 30 independent (using non-overlapping sets of video frames) Support Vector Machine (SVM) classifiers were trained to classify frames (each frame represented by 17 values) as belonging to control or experimental group (all delays d0-d6 considered together; see Materials and methods). Each classifier is represented by 17 points - one for each parameter. Each point is the weight associated with a given parameter for one classifier, and the bar height represents the mean over classifiers (*p<10−4, one-sample t-test with Bonferonni correction for multiple comparisons; see Materials and methods). (C) The percent of frames correctly classified using the SVM classifier. Each dot is the prediction of a single SVM classifier, trained to classify frames as belonging to control or experimental group (d0, d3, d6, or d0-d6 together) – 30 classifiers and their mean plotted for each group. (D) K-means was used to cluster frames based on the eight most significant parameters (marked with asterisks in (B)). The largest 7 clusters include 90.4% of the frames (see inset). Clustering was performed 30 times (black dots; bars = mean), using different but overlapping sets of frames. The same number of frames was taken from each group (see Materials and methods). Cluster 2 (blue box - ‘female shoving’) is more probable following pC1-Int activation (in d0, d3 and d6 conditions) compared to control, while cluster 4 (green box- ‘female chasing’) is more probable in the d3 condition only compared to control. At right, schematic describing the male-female interaction in each cluster, based on the mean values of the weights. (E) JAABA-based classification of shoving (top) and chasing (bottom) behaviors. Each dot represents a single pair of flies. The fraction of time the male-female pair spent shoving (0.037/0.21/0.27/0.15 for control/d0/d3/d6) or chasing (0.013/0.030/0.079/0.022) are shown. Black lines represent significant differences with p<0.05 after Bonferroni correction for multiple comparison. Red lines - significant before, but not after correction for multiple comparisons. (F) Fraction of time females spent chasing or shoving (moving average with a 2-min window), based on JAABA classification in each condition (control, d0, d3, d6). T = 0 is the time the male was introduced (see Figure 1E), and the vertical dashed line indicates the time, for each condition, when 80% of the pairs copulated. Behaviors are not scored after copulation.

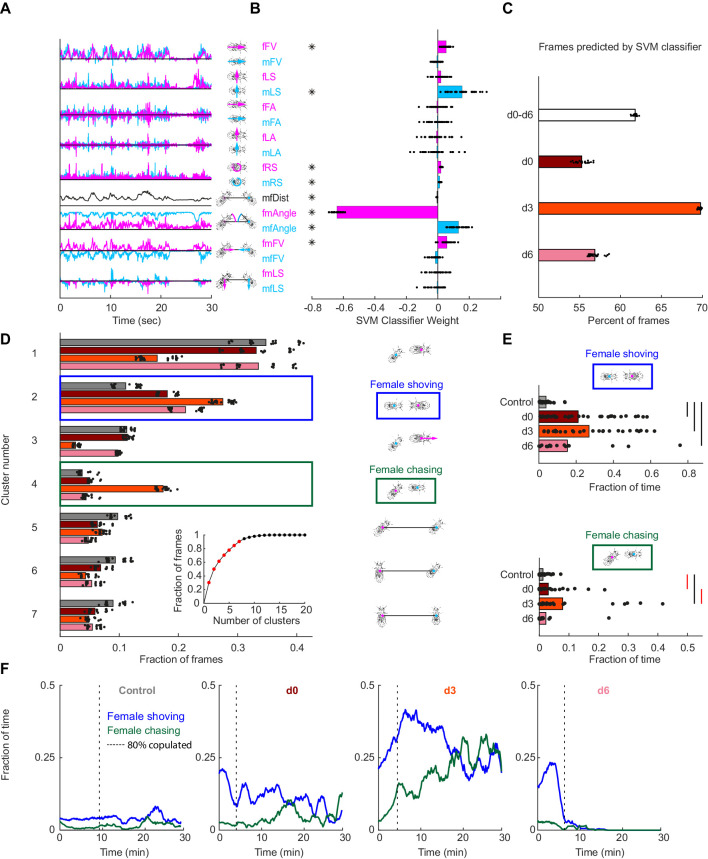
Figure 2.

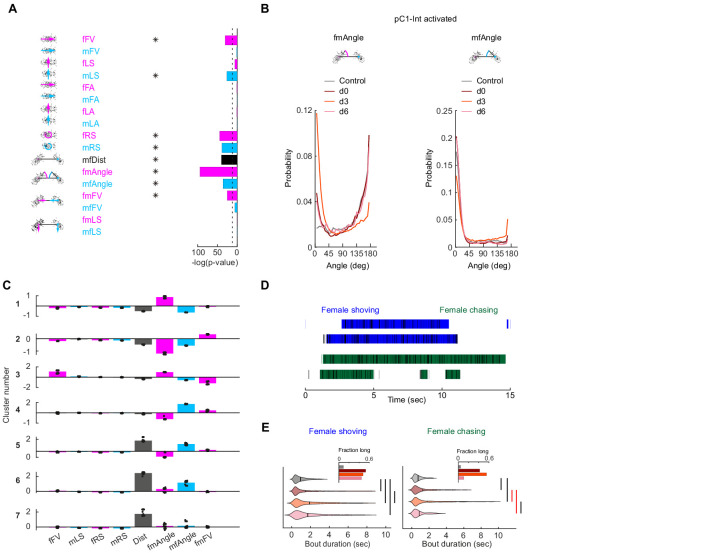
Figure 2—figure supplement 1. Detection of female shoving and chasing from male and female movements.

Figure 2—figure supplement 1.

(A) Bar height indicates -log(P-value) for the probability that the mean distribution of SVM (Support Vector Machine) weights (over 30 independent classifiers) associated with each weight (Figure 2B) is significantly different than zero. Natural log is used. Dashed line indicates p-value=10−4. Asterisks indicate weights associated with distributions with p-value<10−4, using Benferroni correction for multiple comparisons. (B) Distribution of fmAngle and mfAngle (Figure 2A) are shown for four experimental conditions (4.5 deg bin size). fmAngle/mfAngle are the absolute number of degrees the female/male needs to turn in order to point to the centroid of the other fly (see cartoons). (C) The weights associated with each behavioral cluster (Figure 2D), for the eight significant weights (A) that were used for clustering. Each dot represents a single clustering repeat (see Materials and methods). (D) Frames that belong to the shoving (blue) or chasing (green) behavioral clusters (Figure 2D) are indicated as black horizontal lines. JAABA classification for the same 15 s is indicated as horizontal bars. (E) Violin plots (MATLAB violin) are shown for bout duration of female shoving (left) and chasing (right) bouts based on JAABA classification. Means are shown as black lines (0.99/1.47/1.88/1.7 s for control/d0/d3/d6). Black vertical line indicates a significant difference between groups (p<0.05, two sample t-test). Red line indicates that the difference is significant only if multiple comparison correction is not applied. Inset: The fraction of all frames in the experiment that belong to long bouts (≥5 s). In the main plots (but not in the insets and not for statistical measures), the smallest and largest 5% bout durations were excluded for each condition.
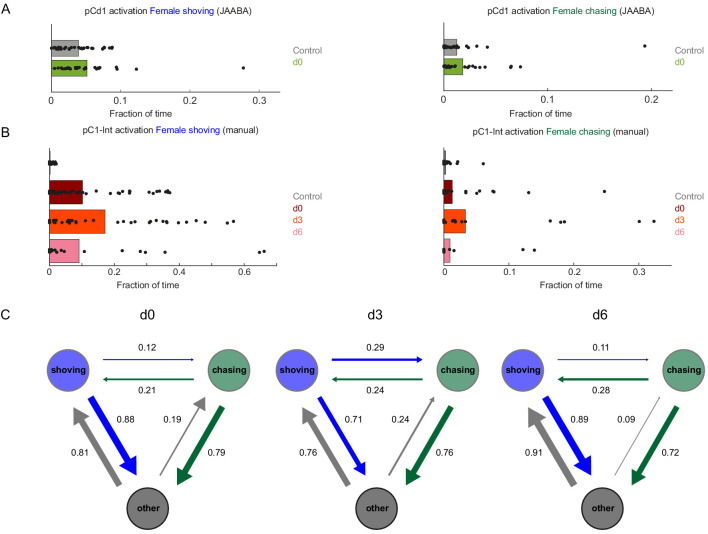
Figure 2—figure supplement 2. Female shoving and chasing detected using machine learning, and validated by manual inspection.

Figure 2—figure supplement 2.

(A) Fraction of time the female spent shoving (left) or chasing (right) following pCd1 activation, based on JAABA classification. (B) Fraction of time the female spent shoving or chasing following pC1-Int activation, based on manual scoring. (C) Conditional probabilities (the probability for a given transition, given that a transition occurred) for chasing, shoving and other (no shoving and no chasing) for the d0, d3, and d6 conditions, following pC1-Int, 5 min activation. Arrow width is proportional to probability. Shoving and chasing classification is based on JAABA.
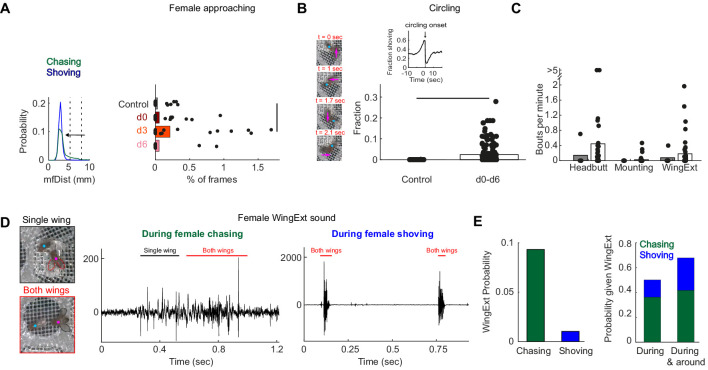
Figure 2—figure supplement 3. Manually-detected persistent behaviors in females, following pC1-Int activation.

Figure 2—figure supplement 3.

(A) Left: Distribution of mfDist (male-female distance) during female chasing (green) and shoving (blue) for d0-d6 conditions. The horizontal arrow illustrates the criterion used for defining ‘female approaching’ events: the female approaches the male from a large distance (>98 percentile mfDist during shoving or chasing) to short distance (<95 percentile for distance mfDist during shoving/chasing), while continuously heading towards the male (fmAngle <30 deg). Right: The percent of frames for each condition that belong to ‘female approaching’ epochs. Black line indicates significant difference (p<0.05, two sample t-test with Bonferroni correction for multiple comparisons). (B) Left: Four example frames from a single ‘circling’ epoch, separated by 90 deg in the female heading direction (see also Video 3). In this example, a female completed 270 deg in 2.1 s. Right: Fraction of time the male and female spend ‘circling’ based on manual annotation. The difference was statistically significant between the control and conditions d0-d6 taken together (p<0.05, two sample t-test), but not when considering each condition alone. Inset: The fraction of time the female spent shoving (d0–d6) aligned to circling onsets indicates high probability for shoving shortly before circling onset. (C) Number of bouts per minute are shown for manually detected behaviors: ‘female headbutting’, ‘female mounting’ and female extending one or two wings (see Videos 2 and 3). The two points with >5 represent 5.5 and 8.1 bouts per minute. (D) Example frames with female unilateral (top) or bilateral (bottom) wing extension (WingExt). Middle: example sound trace during female chasing with unilateral and bilateral wing extensions. Right: example sound trace during female shoving with bilateral wing extension. Note that the sound evoked by female wing extension during shoving was an order of magnitude larger than the sound evoked when the female extended one or two wings during chasing. (E) Left: Female wing extension was manually detected in 9.3% of all frames (d0-d6 taken together) during chasing epochs, and in 1% of the frames during shoving epochs. Right: 50% of the frames detected as ‘wing extension’ were part of female chasing or shoving, and 67.9% of the frames with female wing extension occurred during or around chasing or shoving bouts (‘around’: 2 s before epoch onset until 2 s after epoch offset).