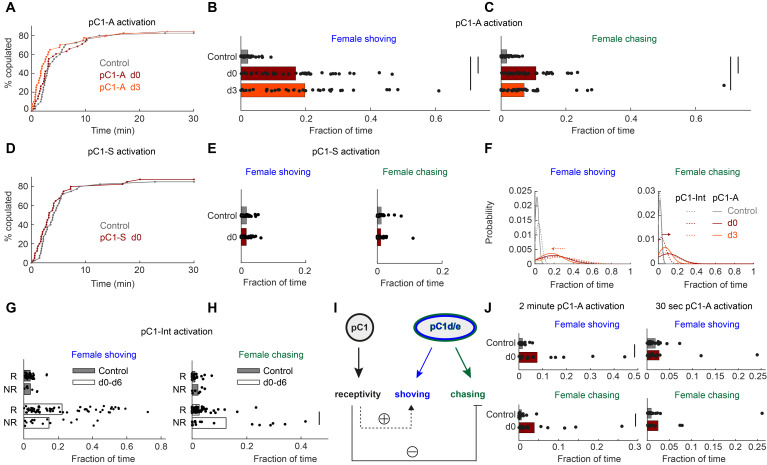
Figure 4. pC1d/e neurons drive female shoving and chasing, but do not affect receptivity.
(A) pC1-A activation did not affect copulation rates in either the d0 or d3 conditions (n = 40, 38, 40 for control/d0/d3; p=0.79 or 0.29 for control vs d0 or d3; Cox proportional hazards regression, see Materials and methods). (B, C) Shoving (B) and chasing (C) probabilities (control/do/d3: 0.02/0.17/0.20 and 0.018/0.11/0.07 for shoving and chasing) were significantly higher in both the d0 and d3 conditions compared to control (two-sample t-test; *p<0.05). (D–E) same as (A–C), but for pC1-S activation. pC1-S activation did not affect either copulation rate (D) or shoving or chasing (E) probabilities (control/do: 0.02/0.02 and 0.01/0.01 for shoving and chasing). (F) Probability distribution of the fraction of time the female spent shoving (left) or chasing (right) following pC1-A activation (solid line) or pC1-Int activation (dashed line). Arrows indicate the difference in peak shoving (at d3; two-sample t-test, p=0.11) or chasing (at d0; two-sample t-test, *p=4.5*10−4) probability, between pC1-Int and pC1-A activation. Bonferroni correction was used for multiple comparisons. (G) Fraction of frames with shoving for pairs in which females copulated (R - Receptive) or did not copulate (NR – Not Receptive) for all experimental conditions taken together (d0–d6). Each dot is a single pair, and the bar value is the mean over all pairs (p=0.92 and 0.13 for control and d0-d6). (H) Same as (G), for female chasing (p=0.13 and p<10−5 for control and d0-d6). (I) Female pC1d/e cells drive persistent shoving and chasing, but do not affect female receptivity. Female receptivity, controlled by a separate pC1 subset labeled in the pC1-Int line, suppresses female chasing, while possibly enhancing female shoving. (J) Shoving and chasing probabilities (control/d0: 0.077/0.015 and 0.039/0.006 for shoving and chasing; p=0.026 and 0.035; n = 20/20 for control/d0) were significantly higher in the d0 condition compared to control following 2 min of pC1-A activation, but not following 30 s (n = 20/21 for control/d0) of pC1-A activation (p=0.52 and p=0.24 for shoving and chasing).
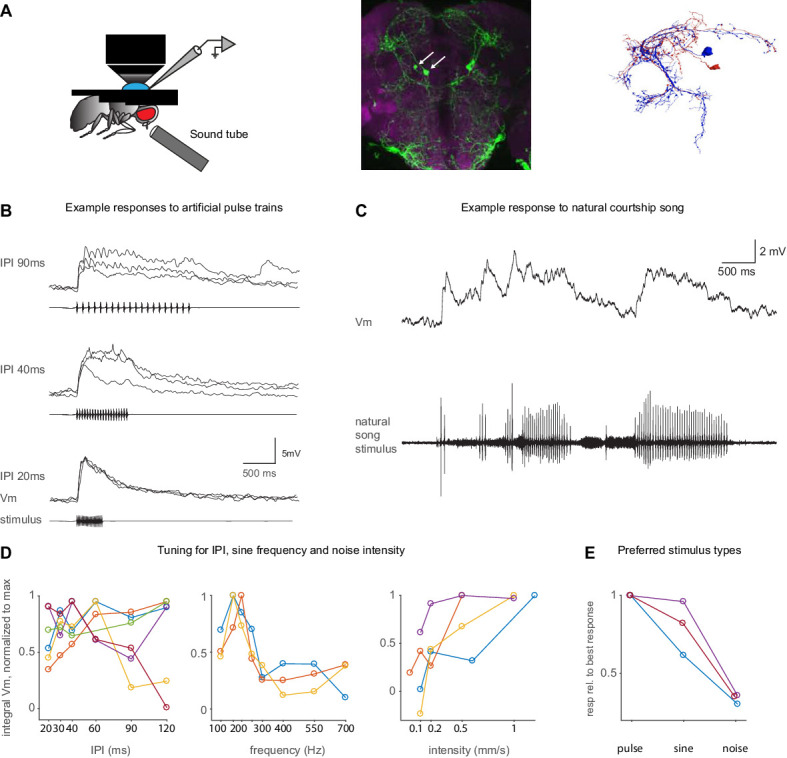
Figure 4—figure supplement 1. Auditory responses in pC1d/e neurons recorded via whole-cell patch clamp.


