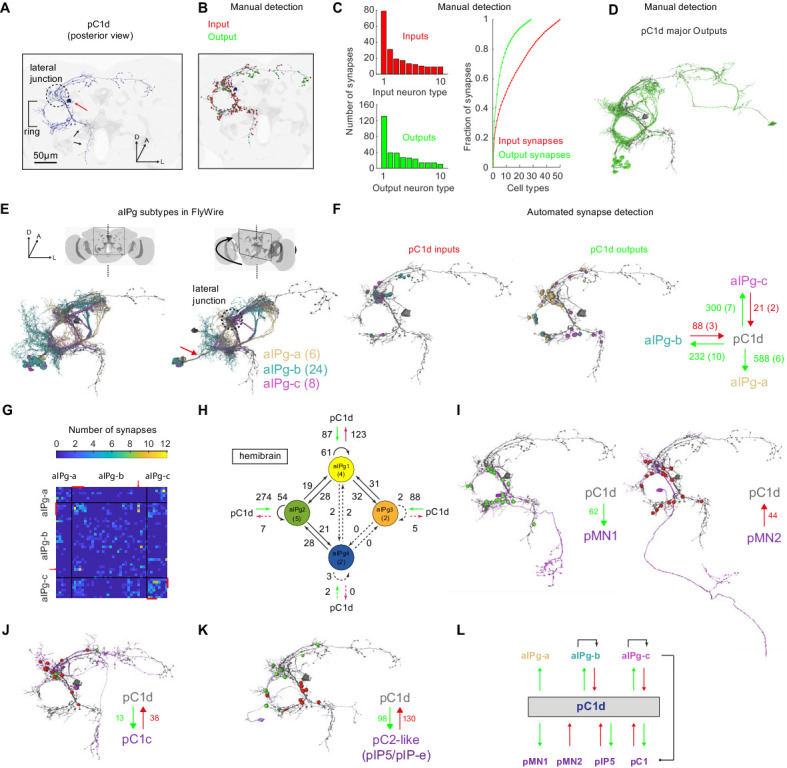
Figure 5. The connectome of pC1d reveals recurrent connections with aIPg neurons.
(A) The left pC1d cell (posterior view) reconstructed in FlyWire following automated segmentation and manual proofreading. The cell body is marked with a red arrow, and the pC1d long medial projection (that does not exist in other pC1 types) is marked with black arrows. (B) Same cell as in (A), with manually detected synapses. Neurons pre-synaptic (inputs to pC1d) are marked in red, and neurons post-synaptic (outputs of pC1d) in green. After excluding segments connected to pC1d with less than three synapses, we counted 417/421 manually-detected input/output synapses (see also Video 4). (C) Left: pC1d inputs (66 cells) and outputs (50 cells) were classified into cell types based on morphology. The number of input (top) or output (bottom) synapses are shown for each cell type, sorted (separately for inputs and outputs) based on the total number of synapses with pC1d for each type. Right: The cumulative fraction of synapses counted as a function of the number of cell types included (calculated separately for inputs/outputs). The three most common output types encompass 49.4% of all output synapses, while the three most common input types encompass 30.5% of all input synapses. (D) The cells that belong to the most common cell types (50% of all output synapses) are shown for pC1d output cells. Note that pC1d has postsynaptic connections with both left (ipsilateral to cells body) and right (contralateral) aIPg cells. (E) Left: Posterior view (same as in (A)) of pC1d (gray) and aIPg cells. Right: rotated view, showing the separation between three subtypes of aIPg cells (6/24/8 for aIPg-a/b/c), sorted according to their projections. See Table 1 for the full list of FlyWire detected aIPg cells in one hemisphere. (F) Synapses between pC1d (gray) and individual example aIPg cells, color coded by aIPg type as in (E). Total synapse count for each type is summarized. Synapses were detected automatically (Buhmann et al., 2019). Only cells with six synapses or more with pC1d are included in the analysis (See Materials and methods and Table 1 for more details). (G) Connection matrix between pairs of aIPg cells. The number of synapses (Buhmann et al., 2019) between a given pair of aIPg cells are indicated with a colorscale. Black lines separate aIPg subtypes. Red lines denote the aIPg cells that are reciprocally connected with pC1d (with si synapses or more each way), and red arrows indicate an aIPg-b cell that is reciprocally connected to cells that form reciprocal connections with pC1d. (H) The number of synapses within and between groups of aIPg cells based on the fly hemibrain connectome (Scheffer et al., 2020). The number in parentheses indicates the number of cells per group (aIPg-1–4). Round arrows indicate within-group connections (e.g. 61 synaptic connections between pairs of aIPg-1 cells). Dotted arrows are shown for weak connections (under five synapses). (I) pC1d connections with Dsx+ pMN1 and Dsx+ pMN2 cells. (J) An example Dsx+pC1 cell (type pC1c) that is recurrently connected to pC1d. (K) pC1d connections with pC2-like cells (with similar morphology as hemibrain pIP5 neurons or Fru+ pIP-e clones from Cachero et al., 2010). (L) pC1d is a hub connecting Dsx+ or Fru+ pC1, pIP5, pMN1, and pMN2 neurons with Fru+ aIPg neurons.

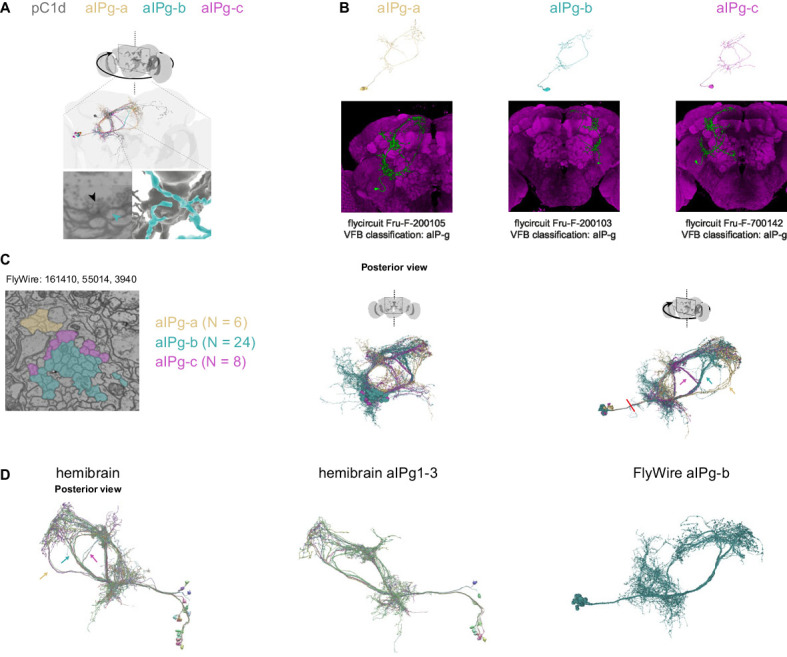
Figure 5—figure supplement 1. Comparison of aIPg cells identified in FlyWire and Hemibrain.

