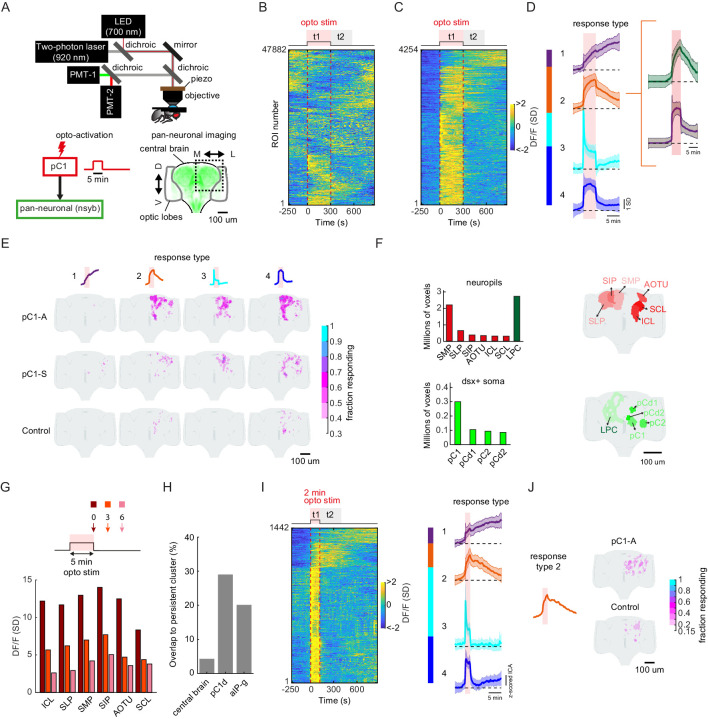
Figure 7. pC1d/e neurons drive persistent neural activity in the central brain.
(A) Experimental setup. pC1 cells (pC1-A or pC1-S) expressing csChrimson were activated through the objective using an LED (700 nm). GCaMP6s and tdTomato were expressed pan-neuronally using the nsyb driver, and a custom-designed two-photon microscope was used to image brain activity before, during and after pC1 activation (see Key Resources Table for genotypes and Materials and methods for more details on the experimental setup). (B) Brain activity recorded in response to optogenetic stimuli (n = 28 flies, all genotypes). GCaMP6s signal was motion corrected and 3D-ROI segmented based on correlated activity in neighboring voxels (see Materials and methods). The z-scored signal of all ROIs (n = 47882 ROIs from both pC1-S and pC1-A activation and control experiments) are plotted in units of standard deviations (see scale bar), and shown 5 min before activation, during activation (t1), and 9.5 min post-activation (t2 marks the first 5 min post-activation). Red dashed line depicts the optogenetic stimulus onset and offset. (C) pC1 activation evokes both transient and persistent activity. Subset of ROIs from panel (B) were selected based on mean z-scored activity during (t1) and after photoactivation (t2), and ROIs were sorted by hierarchical clustering of temporal dynamics. We found 4254 responsive ROIs, defined as ROIs with Ft1 > 3σo (σo - standard deviation during baseline, Ft1 is the mean fluorescence during t1), including transient (Ft2 ≤ 3σo, blue and cyan; Ft2 is the mean fluorescence during t2) or persistent (Ft2 >3σo, orange and purple) response types . (D) Mean ± SD for response types 1–4. In response types 1 and 2, the activity level (calcium response) persists after activation offset, while for types 3 and 4, the activity is high during, but not after photoactivation. The two major sub-clusters of response type 2 are shown at right. (E) Maps of transient and persistent activity types. ROIs from response types 1–4 per animal were registered to an in vivo intersex atlas (Pacheco et al., 2021) to generate probability density maps across animals per brain voxel (each voxel is 0.75 × 0.75 × 1 µm3). Activity maps are maximum-projected along the anterior-posterior axis, and overlaid onto the brain template, color coded by the fraction of flies showing activity at each voxel (ranging from 30% to 100%). We considered a voxel to consistently have a particular response type if active in over 30% of flies. Response type 2 shows persistent activity following pC1-A activation, and occupies 4.3% of the volume imaged, compared with 0.6% following pC1-S and 0.2% in control flies. (F) Brain regions containing persistent responses (type 2). We used both anatomical segmentation of the in vivo brain atlas (Pacheco et al., 2021) and segmentation of the Dsx+ circuit (also registered to the same atlas) into processes in the LPC and major groups of cell bodies (pC1, pC2, pCd1, pCd2) to assign ROIs to neuropils (red) or overlap with Dsx+ neurons (green). For each of these regions, we calculated the average number of voxels or volume (across-individuals) occupied by all ROIs belonging to response type 2, following pC1-A activation. Neuropils were sorted by the number of voxels, and the top six neuropils are shown. pC2m and pC2l are shown together as pC2, as they are not always spatially separable in females. For responses in other conditions (pC1-S, control) and other neuropils see Figure 7—figure supplement 1A. (G) Mean response (DF/F) over all flies and ROIs per brain neuropil from (F), at t = 0 (stimulus offset), t = 3 min and t = 6 min. Time points relative to stimulus are shown in arrows in the schematic. Each ROI's activity was z-scored relative to the baseline; therefore, DF/F units are plotted in standard deviation (SD) relative to baseline activity. (H) The percent of voxels that belong to the persistent cluster (response type 2) out of the volume imaged in the central brain (4.3%), out of the voxels that include pC1d (29.04%), or out of the voxels that include aIPg cells (20.14%); see Materials and methods – pC1d and aIPg neurons from FlyWire were registered into the in vivo atlas for comparisons. (I) Shorter duration (2 min) pC1-A activation also evokes both transient and persistent activity. ROIs for both control and pC1-A activation (using the same criteria as in (C)) could also be clustered into four response types (purple, orange, blue, and cyan) similar to (D). (J) Map of persistent activity type 2 upon 2 min pC1-A stimulation.


