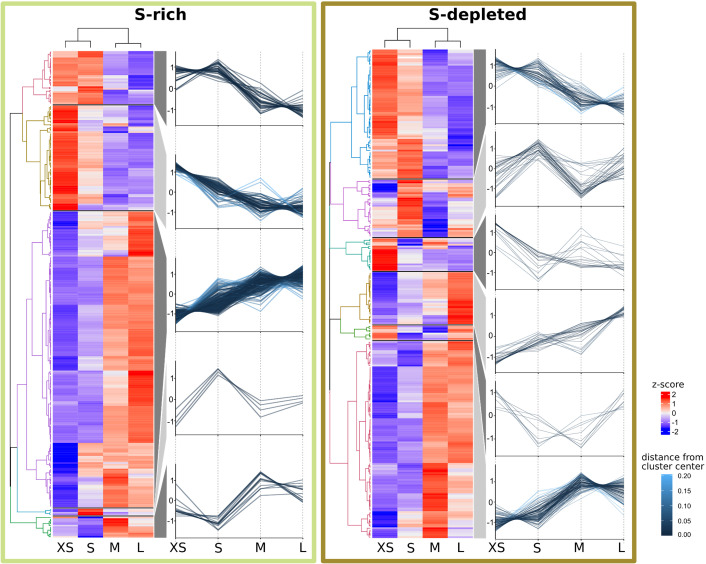
Appendix 1—figure 1. Abundance trends of 465 Riftia symbiont proteins with significant abundance differences between the four analyzed gradient fractions XS (enriched in very small symbiont cells) to L (containing the highest percentage of large symbiont cells) in S-rich and S-depleted Riftia trophosomes.
Heat maps show relative protein abundances (z-scores of edgeR-RLE-corrected spectral count values; see Methods for details) and line graphs indicate trends in the observed differences.

