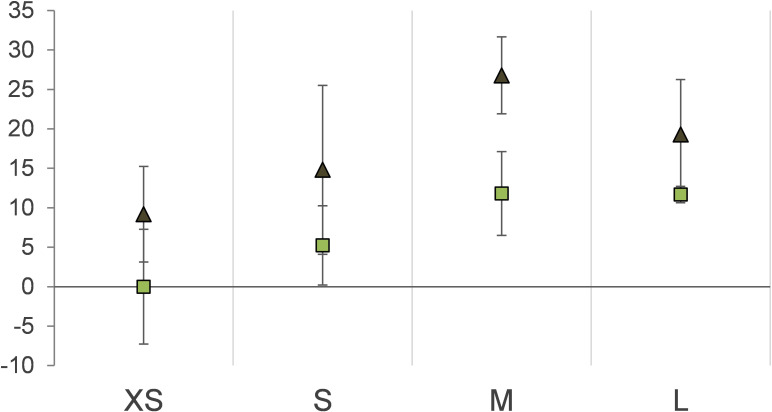
Appendix 1—figure 2. Protein stable carbon isotope values (δ13C values) of Riftia gradient fractions enriched in symbionts of different cell size (XS – L) relative to fraction XS of S-rich trophosome as baseline.
Light squares: S-rich symbionts (average values, n = 4), dark triangles: S-depleted symbionts (n = 3). Error bars indicate standard errors of the mean.

