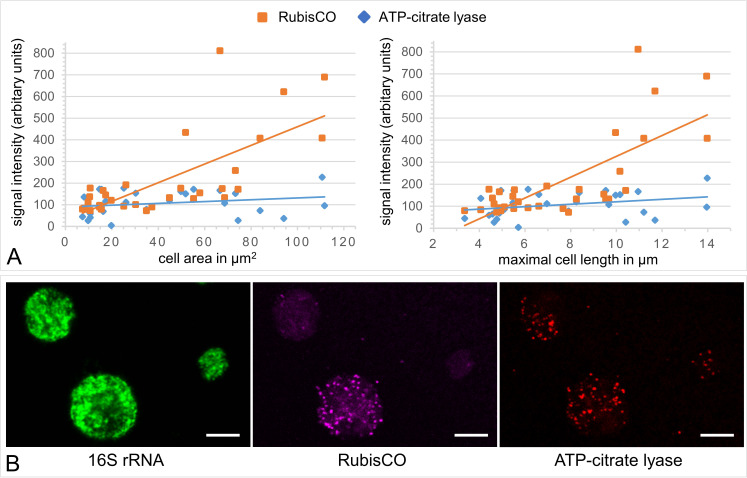
Appendix 1—figure 3. A gradient fraction enriched in large symbionts (but also containing small symbiont cells) was fixed as for CARD-FISH analysis and incubated with fluorescently labeled RNA probes against the Endoriftia 16S rRNA and the mRNAs of Calvin cycle key enzyme RubisCO and rTCA cycle key enzyme ATP-citrate lyase (subunit AclB) before examination by confocal laser scanning microscopy (CLSM, see Materials and methods).
(A) Background-corrected mean signal intensities per pixel calculated from a total of 33 cells (in eight images on a filter from one biological replicate, n = 1) plotted against cell area (left) and Feret’s diameter of the cell (right). Straight lines indicate the linear between mean pixel intensities and cell size. Average RubisCO mRNA signal intensity increased notably with cell size (orange lines), while AclB signal intensity increased only very slightly (blue lines). (B) CLSM image of Endoriftia cells (the same cells are visible with different fluorophores in the three panels). Supporting the quantitation in (A) and in line with our proteomic results, the RubisCO signal is markedly more intense in large symbiont cells than in small cells, while the AclB signal is very weak and signal intensity differences between large and small cells seem to be minor. Scale bar = 5 µm. Image brightness and contrast were manually adjusted. Hybridizations of several filters from one biological replicate (n = 1) without probes but with fluorophore-carrying hairpins, and without probes or hairpins were used as negative controls and produced no fluorescence signals (images not shown).

