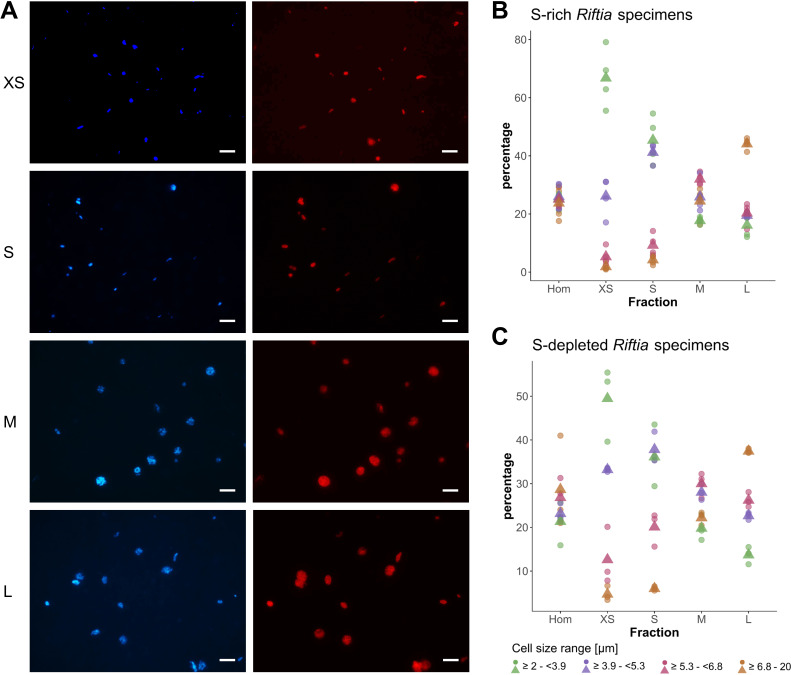
Figure 1. CARD-FISH images of Riftia symbiont cells after density gradient centrifugation.
(A) Catalyzed reporter deposition-fluorescence in situ hybridization (CARD-FISH) images of Riftia symbiont cells after density gradient centrifugation of trophosome homogenate. After the enrichment procedure, small bacterial cells had accumulated in the upper, less dense gradient fractions (top), whereas larger symbionts were enriched in the lower, denser fractions (bottom). Left: DAPI staining, right: 16S rRNA signal. For better visibility, brightness and contrast were adjusted in all images. Between 300 and 1300 individual cells were measured per filter (average: 590). (B and C) Symbiont cell size distributions in individual gradient fractions. While all cell size groups were roughly equally abundant in non-enriched trophosome homogenate (Hom), fraction XS had the highest percentage of symbiont cells in the size range 2.0 µm - 3.9 µm, fraction S contained most symbiont cells of 3.9 µm – 5.3 µm, etc. Gradient centrifugation was performed using four biological replicates (n = 4) of sulfur-rich trophosome tissue (B) and three biological replicates (n = 3) of sulfur-depleted trophosome tissue (C). For an overview of which gradient fractions were chosen as fractions XS, S, M, and L in all samples see Supplementary file 1. Dots: individual % values, triangles: average % values. Please note the different scaling of the y axes in B and C.

