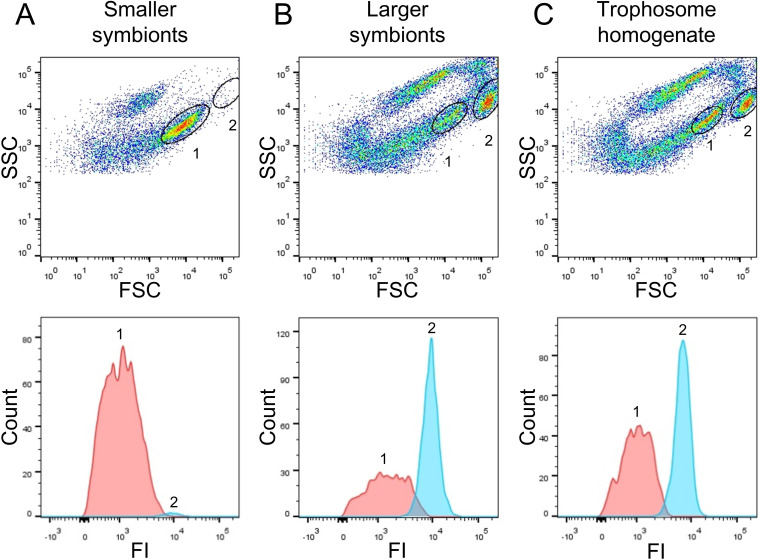
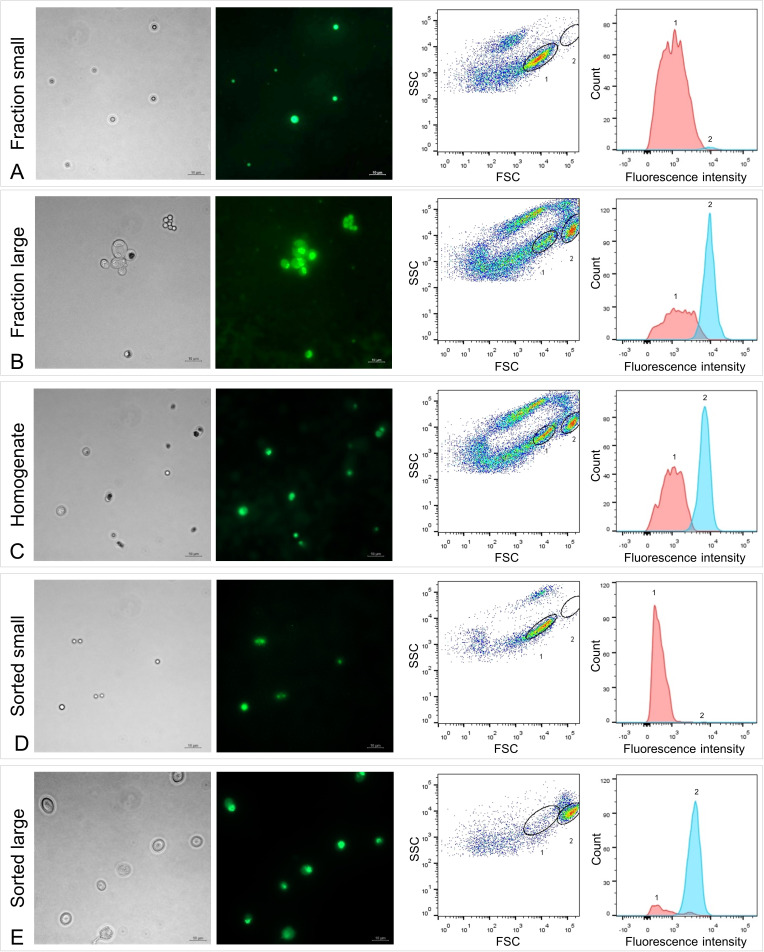
Left: Micrographs (Phase contrast and Syto9 staining), right: Flow cytometry dot plot (FSC: forward scatter, SSC: side scatter) and histogram. To identify symbiont subpopulations of different cell sizes, a set of six individual gradient fractions enriched in large symbiont cells and a set of six gradient fractions enriched in small symbiont cells were examined and compared (note that only one pair of microscopy images and only one of the six dot plot/histogram pairs per sample set are shown). (
A) Those fractions that were enriched in small symbiont cells of 2–3 µm in diameter produced dot plots with a highly abundant cell population 1 (encircled in black), which we assumed to be specific for small symbionts. (
B) In contrast, gradient fractions enriched in large symbionts of up to 10 µm in diameter produced dot plots in which population 1 was notably less prominent, while a second population (2) was highly abundant. Population 2 was almost completely absent in (
A) and therefore presumably specific for large symbionts. (
C) Non-enriched trophosome homogenate contained a mixture of cells and particles of different sizes. Both cell populations determined in (
A) and (
B), presumably indicative of small (1) and large (2) symbionts, were also visible in the homogenate’s dot plot and histogram, which allowed us to measure and compare their respective fluorescence signal intensities. Median fluorescence intensity per particle of population 1 was consistently (throughout all samples) lower than that of population 2, even if cell counts for population 1 were higher than for population 2 (e.g.,
A, D). The green fluorescent dye Syto9 stains DNA and RNA. After removal of RNA from the samples by RNase treatment we could therefore quantify DNA content in populations 1 and 2 (see
Supplementary file 6). (
D and E) Sorting of the two populations 1 and 2 from trophosome homogenate and subsequent examination of the resulting sorted cell suspensions by microscopy and flow cytometry confirmed that these two populations are indeed small (
D) and large (
E) symbiont cells. Trophosome homogenate and gradient fractions used in this analysis originated from two
Riftia specimens with medium sulfur content (see
Supplementary file 1 for details). Scale bar: 10 µm.


