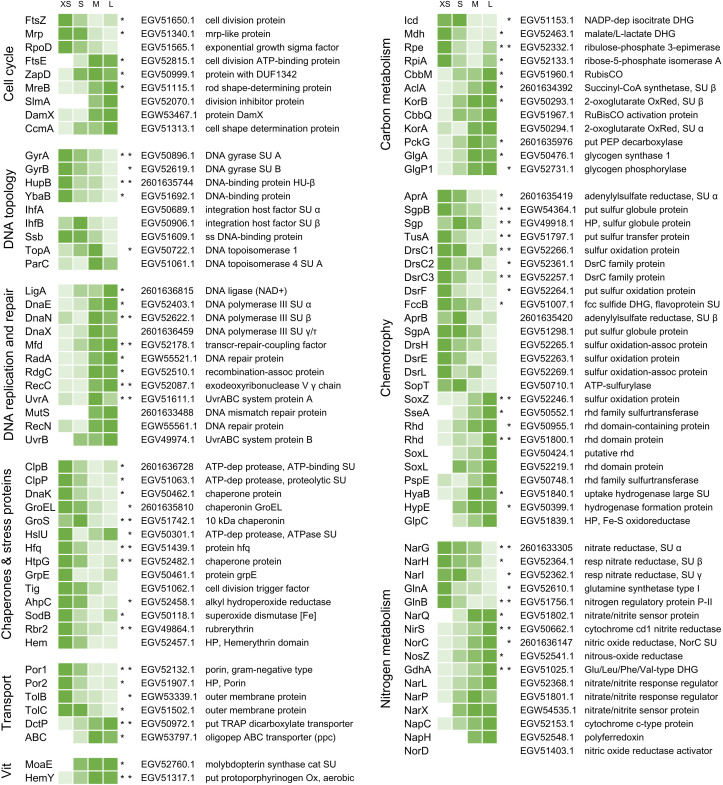
Figure 3. Abundance trends of selected Endoriftia proteins of various functions in the four fractions XS to L.
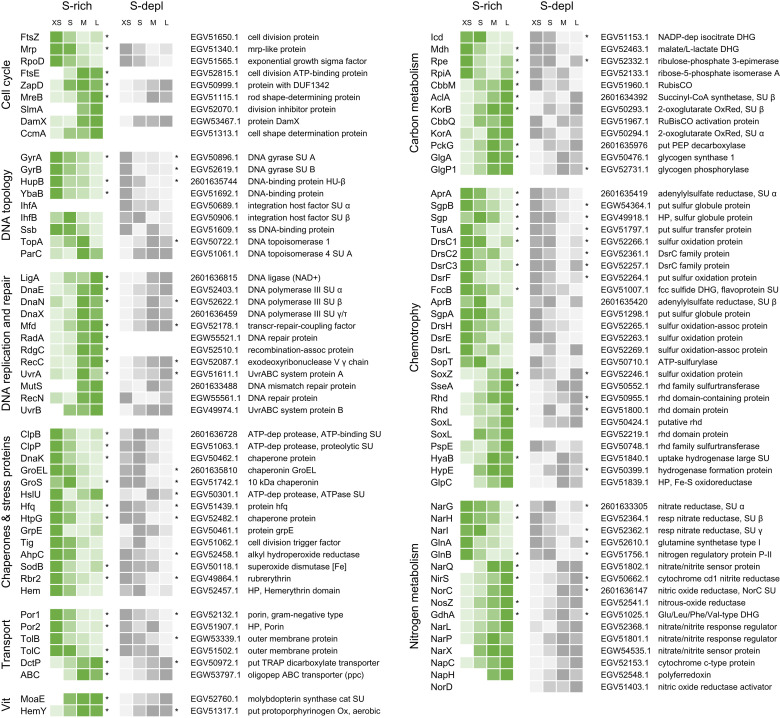
Trends are indicated by color shades from light green (lowest protein abundance across all four fractions) to dark green (highest abundance across all four fractions; note that colors do not allow comparison of protein abundance between proteins). Abundance values in the heat map are based on statistical evaluation of four biological replicates with sulfur-rich trophosomes (for abundance trends of sulfur-depleted samples refer to Figure 3—figure supplement 1 and Appendix section B). Proteins marked with asterisks show statistically significant trends, that is, differences that are consistent across all replicates in S-rich (left asterisk) or S-depleted specimens (right asterisk), or both (two asterisks). White cells indicate that this protein was not detected in this sample or too low abundant to be included in statistical analyses. For an overview of all identified symbiont proteins and their relative abundances and for a summary of protein abundance trends sorted by metabolic category see Supplementary files 2 and 3, respectively. Accession numbers refer to NCBI/JGI entries. SU: subunit, DUF: domain of unknown function, ss: single-stranded, transcr: transcription, assoc: associated, dep: dependent, HP: hypothetical protein, put: putative, oligopep: oligopeptide, ppc: periplasmic component, DHG: dehydrogenase: RubisCO: ribulose-1.5-bisphosphate carboxylase/oxygenase, Ox: oxidase, OxRed: oxidoreductase, PEP: phosphoenolpyruvate, fcc: flavocytochrome c, rhd: rhodanese, resp: respiratory, cat: catalytic, Vit: vitamin and cofactor metabolism.


