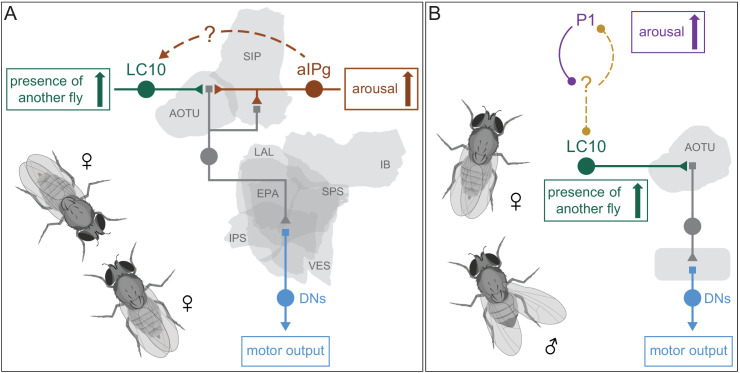
Figure 12. Alternative models for how the saliency of visual input from LC10 neurons is increased by arousal during two different social behaviors.
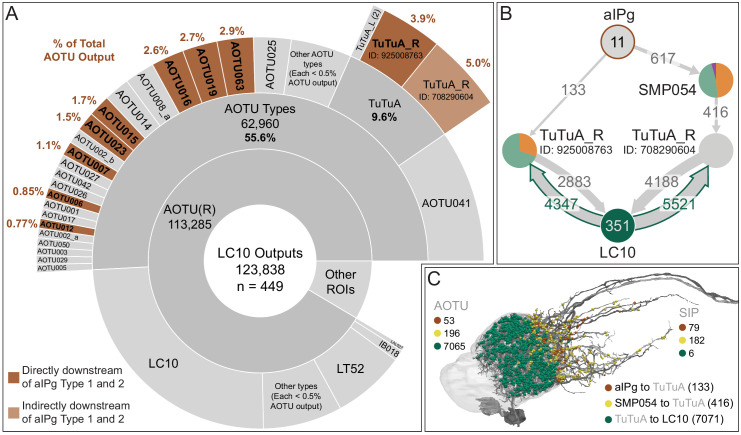
(A) A conceptual model for gating of visual information by aIPg neurons in females during aggression. Several types of projection neurons (represented by the gray neuron) connect the AOTU with ventral brain regions where they then innervate descending neurons (blue) to drive motor behavior (Figure 10B). These projection neurons get input from both aIPg neurons and LC10 neurons, a population of visual projection neurons that are tuned to be activated by a nearby moving fly. The combined activation of these excitatory cholinergic inputs might act synergistically to drive AOTU firing and signaling to DNs. At this point we do not know if the anatomical separation of the aIPg and LC10 inputs to the AOTU neurons (Figure 10—figure supplement 2) is simply a wiring convenience or has functional significance. The dotted arrow from aIPg to LC10 indicates an indirect path mediated by two types of TuTuA neurons (Figure 12—figure supplement 1). (B) A conceptual model based on the work of Sten et al., 2020 for the gating of visual information by P1 neurons in males during courtship. P1 neurons are proposed to act upstream of LC10 such that LC10 neurons produce more synaptic output when male flies are aroused. The nature of the signal transmission between P1 and LC10 has not been determined. See Sten et al., 2020 for details. We note that in addition to transmission at chemical synapses, signaling by neuropeptides also remains a possibility in both models: RNA profiling of LC10a and LC10b neurons from a mixture of males and females (Davis et al., 2020) has shown that both these cell types express the receptor for sNPF (sNPF-R) and our work showed that aIPg neurons express sNPF (Figure 1—figure supplement 5). Similarly, LC10a neurons express two receptors for Tk (TkR86C and TkR99D), while LC10b neurons appear to express only TkR86C at high levels. Tk is known to be an important regulator of male aggression (Asahina et al., 2014), but a role for Tk in courtship has not been established.


