
Figure 4. pC1d, but not pC1e, significantly increases aggressive social interactions in female flies.
(A) MIP (63x) image of the central brain of a female from the pC1dSS1 split-GAL4 line crossed with 20xUAS-CsChrimson::mVenus and stained with anti-GFP antibody. Images of the complete brain and ventral nerve cord of a female and male of the same genotype are shown in Figure 4—figure supplement 1A–C. (B) Percentage of flies engaging in aggressive behaviors over the course of a trial during which a 30 s 0.4 mW/mm2 continuous light stimulus (pink shading) was delivered, plotted as in Figure 1F. (C) Total time an individual spent performing aggressive behaviors during each of four 30 s periods: prior to, during, immediately following, and 30–60 s after the stimulus. Points represent individual flies. Note that we used 20xUAS-CsChrimson for these experiments to be consistent with the experiments done with aIPg split-GAL4 lines, but the levels of aggression observed with pC1dSS1 are actually higher when a weaker effector line (5xUAS-CsChrimson) is used (Figure 4—figure supplement 9A). Box-and-whisker plots show median and IQR; whiskers show range. Kruskal-Wallis and Dunn’s post hoc tests were used for statistical analysis. Asterisk indicates significance from 0: *p<0.05; **p<0.01; ****p<0.0001; n.s., not significant. (D) MIP (63x) image of the central brain of a female from the pC1eSS1 line crossed with 20xUAS-CsChrimson::mVenus and stained with anti-GFP antibody. Images of the complete brain and ventral nerve cord of a female and male of the same genotype are shown in Figure 4—figure supplement 2A–C. (E) Percentage of flies engaging in aggressive behaviors over the course of a trial during which a 30 s 0.4 mW/mm2 continuous light stimulus (pink shading) was delivered, plotted as in Figure 1F. No obvious differences between genotypes were observed. Data supporting the plots shown in the individual panels were as follows: B: 20xUAS-CsChrimson, n = 2 experiments; pC1dSS1, n = 3 experiments; EmptySS > 20xUAS-CsChrimson, n = 5 experiments; pC1dSS1 > 20xUAS-CsChrimson, n = 5 experiments. C: 20xUAS-CsChrimson, n = 29 flies; pC1dSS1, n = 48 flies; EmptySS > 20xUAS-CsChrimson, n = 46 flies; pC1dSS1 > 20xUAS-CsChrimson, n = 53 flies. E: 20xUAS-CsChrimson, n = 2 experiments; pC1eSS1, n = 2 experiments; EmptySS > 20xUAS-CsChrimson, n = 3 experiments; pC1eSS1 > 20xUAS-CsChrimson, n = 3 experiments. For all panels, data are representative of at least three independent biological repeats, one of which is shown here; see Supplementary file 3 for exact p-values.

Figure 4—figure supplement 1. Expression patterns of pC1d split-GAL4 lines.

Figure 4—figure supplement 2. Expression patterns of pC1e split-GAL4 lines.

Figure 4—figure supplement 3. Morphologies of individual pC1d neurons.

Figure 4—figure supplement 4. Morphologies of individual pC1e neurons.

Figure 4—figure supplement 5. Behavioral characterization of female flies after pC1d activation.

Figure 4—figure supplement 6. Optogenetic activation of additional lines labeling pC1d split-GAL4 lines display similar behavioral results to pC1dSS1.

Figure 4—figure supplement 7. Optogenetic stimulation of pC1dSS1 > Chrimson males does not result in aggressive behavior.

Figure 4—figure supplement 8. Optogenetic activation of aggression depends on feeding all trans-retinal.

Figure 4—figure supplement 9. Behavioral effects of stimulus delivery and effector strength.

Figure 4—figure supplement 10. Behavioral effects of the frequency of optogenetic stimulation.

Figure 4—figure supplement 11. pC1d activation also increases aggression against wild-type females and males.

Figure 4—figure supplement 12. pC1d inactivation did not significantly diminish aggressive behavior.
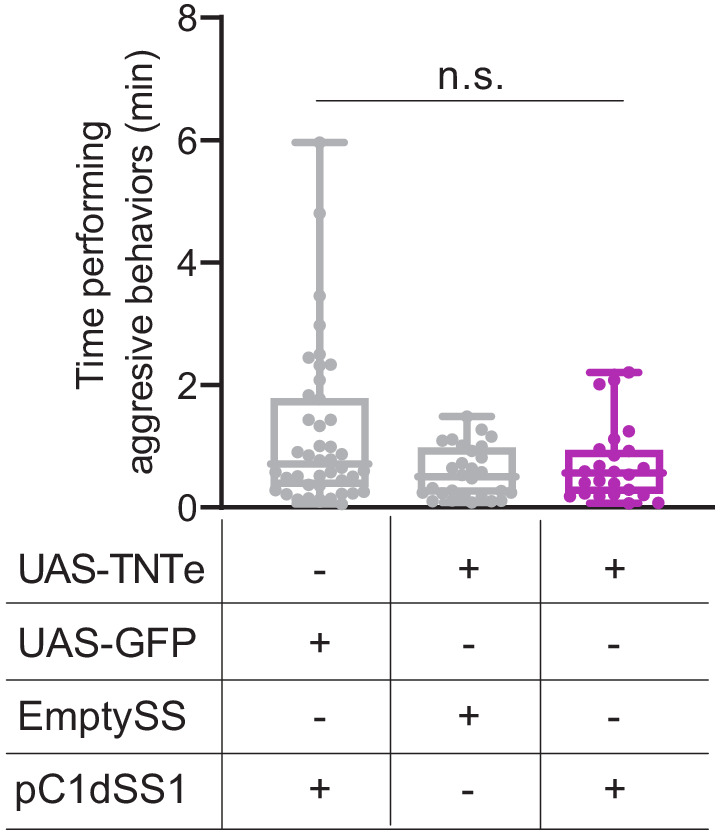
Figure 4—figure supplement 13. Optogenetic activation of additional lines labeling pC1e.

Figure 4—figure supplement 14. Behavioral effects of stimulus delivery and effector copy number.

Figure 4—figure supplement 15. Comparison of activation phenotypes of pC1d, pC1e and pC1a-c.
