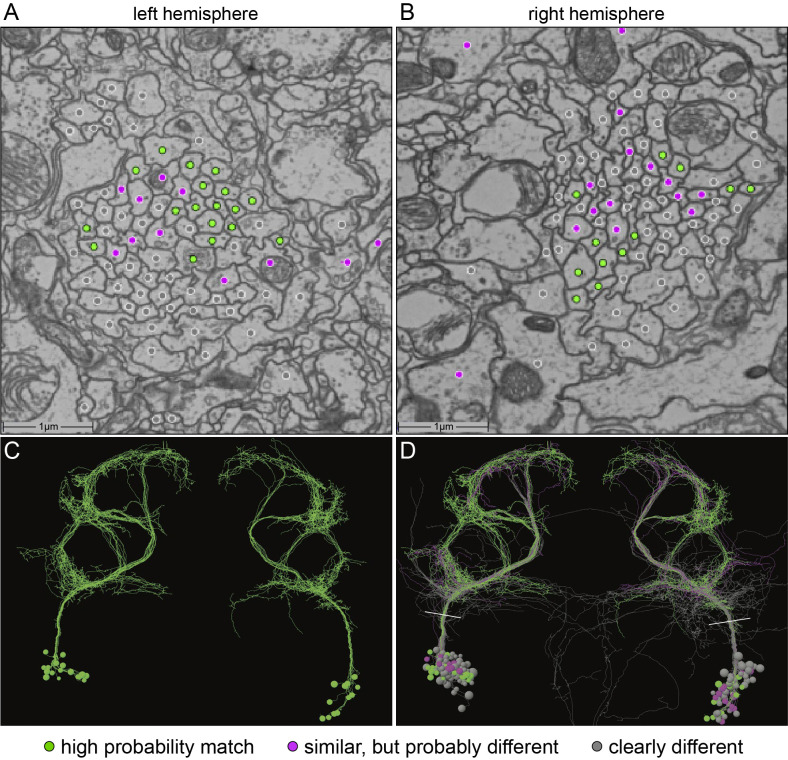
Figure 5. Identification of aIPg neurons in the FAFB dataset.
(A,B) Images of an area of the left and right hemisphere of an EM section from the FAFB dataset containing the fiber tracts of the putative aIP-g neurons described by Cachero et al., 2010. A dot has been placed in each axon, color-coded to reflect the degree of similarity of its morphology, revealed by manual tracing and visual inspection, to the aIPg neurons contained in our split-GAL4 lines. Gray represents neurons whose morphology clearly differed, magenta represents neurons whose morphology were similar but differed in one or more branches, and green represents neurons that we judged to correspond to those in our split-GAL4 lines. Note that, as we often observe in our split-GAL4 lines (see Figure 1—figure supplement 1) and has been reported for many cell types in connectomic studies (see for example, Bates et al., 2020), the number of neurons often differs between hemispheres. In this brain, the left hemisphere had 17 green cells, while the right hemisphere had only 12. (C,D) Skeleton rendering of the traced aIPg neurons, colored based on their similarity to the aIPg neurons identified in our split-GAL4 lines. Panel C shows only cells we judged to correspond to those in our split-GAL4 lines, while D shows all traced cells. White lines in D indicate the approximate plane of the images shown in A and B. Tracing of gray neurons was stopped when it was clear they did not match our split-GAL4 lines; therefore, their arbors are likely to be incomplete in these images.


