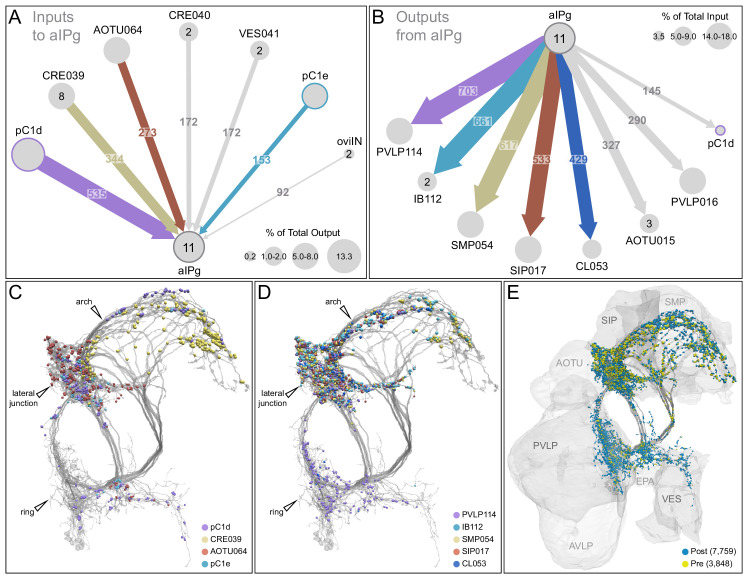
Figure 8. Major inputs to and outputs from aIPg neurons.
(A) Inputs to the 11 aIPg type 1–3 neurons in the right hemisphere; only connections with 150 or more synapses are shown and inputs to all 11 aIPg neurons have been pooled. OviIN was included, even though it did not meet this threshold, due to its involvement in other female behaviors. The size of the circles representing input neurons indicates the percentage of their output (estimated by synapse number) that goes to aIPg neurons. Numbers in the circles indicate the number of neurons of that cell type present, if greater than one. The number of cells and synapses given for a cell type include neurons in the left hemisphere if they are connected to the right-hemisphere aIPgs, with the exception of pC1d where only the right-hemisphere pC1d is shown; pC1d_L makes 71 synapses to aIPgs. (B) Post-synaptic outputs of aIPg neurons; only connections with 290 or more synapses are shown except for pC1d (145 synapses), which has been included to point out reciprocal connections. The size of the circles representing the downstream targets of aIPg indicates the percentage of their input (estimated by synapse number) that comes from aIPg neurons. Only one of the top downstream targets of the aIPg neurons, SMP054, also receives strong input from pC1d, although the connectivity strengths differ considerably between the two, with 14.4% and 1.1% of its inputs provided by aIPg and pC1d neurons, respectively. (C) Positions on the aIPg arbors of post-synaptic sites where the connections diagrammed in (A) occur, color-coded. (D) Positions on the aIPg arbors of the presynaptic sites where the connections diagrammed in (B) occur, color-coded. (E) Positions of aIPg’s pre- (yellow) and post-synaptic (blue) connections to all neurons are shown; relevant brain areas are indicated. See Video 13 for better visualization of the inputs to aIPg neurons and Video 14 for better visualization of their outputs.

