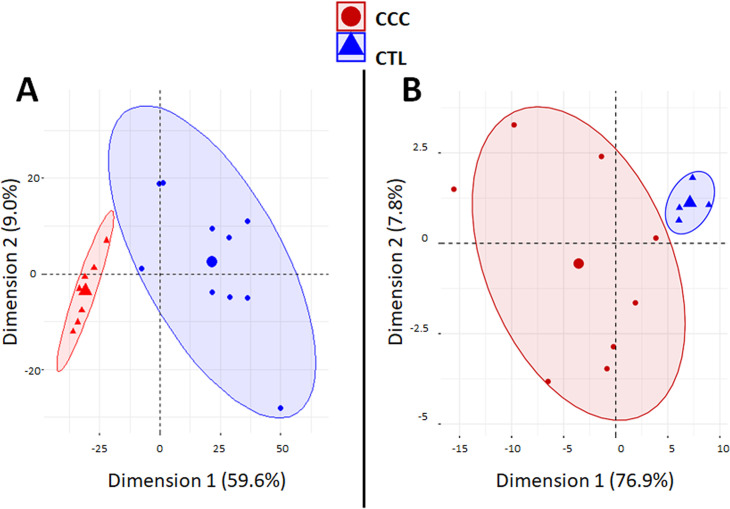
Fig 1. Principal component analysis (PCA) plots.
Principal component analysis (PCA) plot of samples was performed based (A) on 1535 differentially expressed genes (DEGs) between CCC and controls. The two main principal components have the largest possible variance (68.8%). The 1535 DEGs had an equal contribution to the first component (ranging from 6.0E-3% to 0.1%). For the second component, 25 DEGs had a contribution over 0.25% (GAB3, WBSCR27, LOC100130930, C1orf35, ISLR2, SLC25A34, NOTCH2, TSPAN32, ATP1A1OS, C11orf65, ZNF214, APCDD1, C1QTNF6, RANBP17, MNS1, APBB3, ANGPTL1, BEND6, LTB, MMP9, ITGB2, PIK3R1, NOTCH2NL, TRMT5 and XLOC_005730); (B) or on 80 differentially expressed miRNAs (DEMs) between CCC and controls. The two main components explain 84.7% of the variance. For the first component, the 80 DEMS had an equal contribution (ranging from 0.24% to1.74%). For the second component, even if all the DEMs contribute, six of the DEMs have a main contribution (hsa-miR-155: 12.8%; hsa-miR-146a: 9.0%; hsa-miR-302d: 8.8%; hsa-miR-378: 8.1%; hsa-miR-486: 7.0%; and hsa-miR-221: 5.2%).

