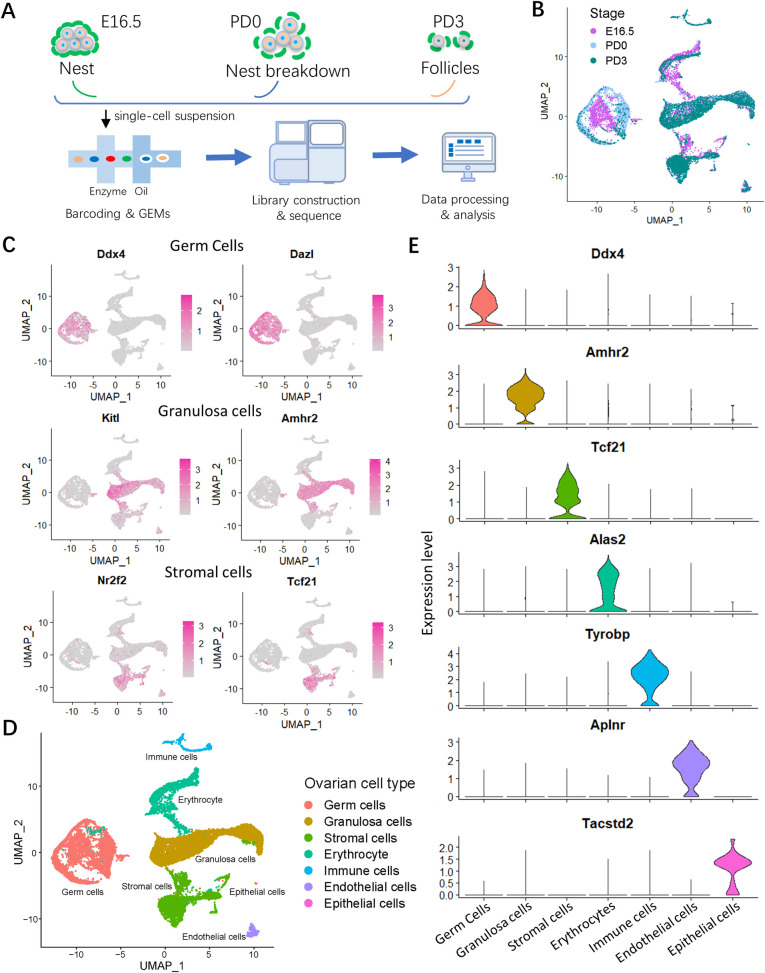
Fig 1. scRNA-seq identified ovarian cell types during PF formation.
(A) Schematic diagram of the scRNA-seq analysis procedure. Ovaries were isolated and disaggregated into single cell suspensions; cells were barcoded and used for library construction onto 10× Genomics platform and the data produced after sequencing analyzed by dedicated software. (B) UMAP plot of ovarian cells colored by the selected developmental time points (that is Stage). E16.5 for medium orchid, PD0 for light blue and PD3 for dark cyan. (C) Feature plots of specific marker genes of different cell types, including germ cells, granulosa cells, and stromal cells. The detailed marker genes of each cell type are shown in S1 Table. (D) UMAP plot of 7 ovarian cell types. (E) Vlnplots of specific marker gene in each ovarian cell type. The sequencing data was deposited availably in GSE134339, and this figure can be produced using scripts at https://github.com/WangLab401/2020scRNA_murine_ovaries. scRNA-seq, single cell RNA-sequencing; UMAP, uniform manifold approximation projection; E16.5, embryonic day 16.5; PD0, postnatal day 0; PD3, postnatal day 3.

