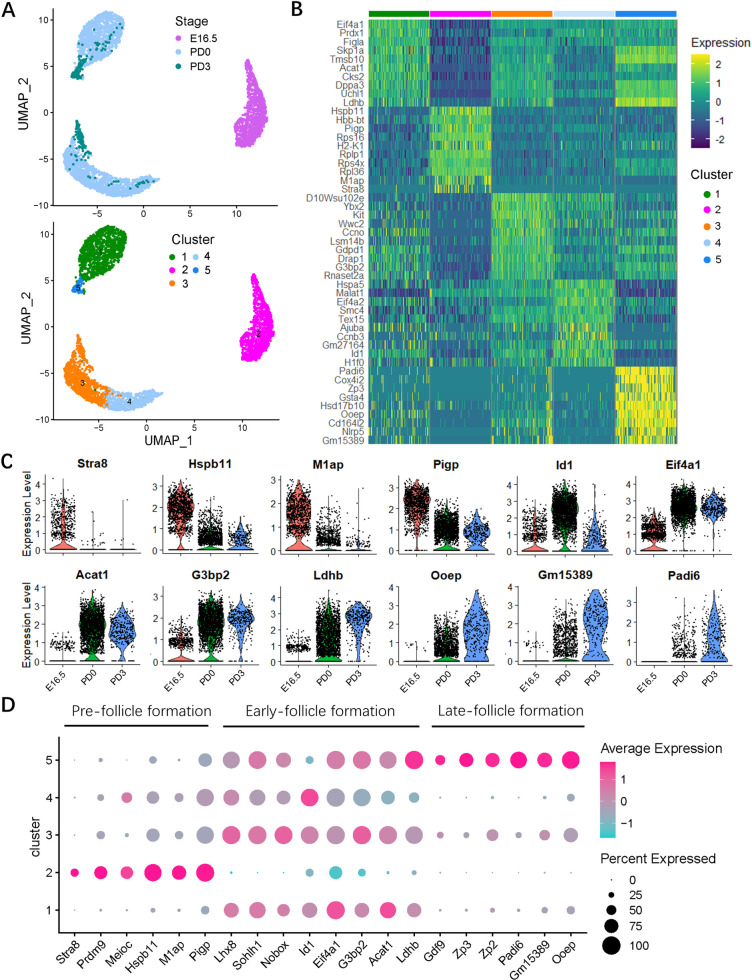
Fig 2. Molecular characterization of the germ cell subsets.
(A) Cluster analysis of germ cells with UMAP plots based on developmental timeline (upper) and transcriptional patterns (below). (B) Heatmap of top 10 marker genes of the germ cell clusters. Top 50 marker genes in each cluster are shown in S2 Table. (C) Vlnplots of the expression level of representative genes along with developmental timeline. (D) Dot plot of general and stage-specific (pre-, early- and late-follicle formations) germ cell marker genes expressed in cell clusters. Dot size represents the cell percentage expressed in each cluster; dot color marks the average expression level of each gene. The sequencing data was deposited availably in GSE134339, and this figure can be produced using scripts at https://github.com/WangLab401/2020scRNA_murine_ovaries. UMAP, uniform manifold approximation projection.

