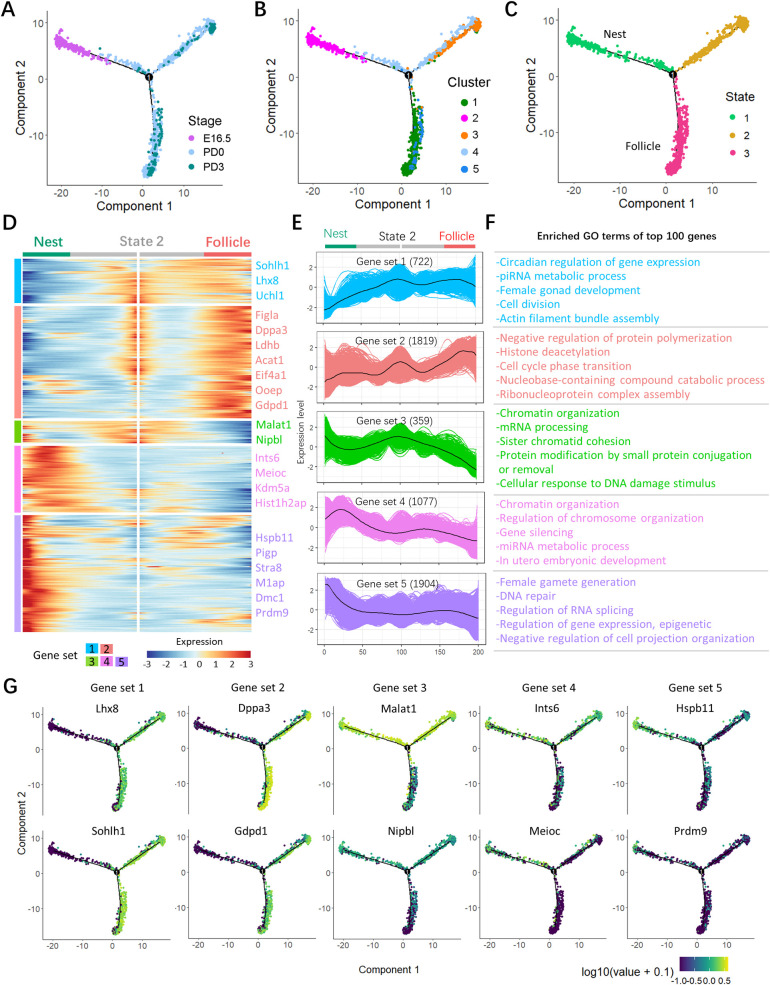
Fig 4. Transition of germ cells throughout distinct states from nest to follicle stages.
(A) Single-cell trajectories of germ cell as a function of developmental timeline. (B) Single-cell trajectories of germ cells along with Seurat cluster. (C) Single-cell trajectories of the 3 germ cell states through the pseudotime. (D) Heatmap representing the expression dynamics of 5 gene sets with increased expression or reduced at the nest and follicle stage. The gene sets were selected with qval < 1 × 10e−4. Detailed information in gene sets is shown in S3 Table. (E) Expression profiles of the differentially expressed genes in the transition from nest to follicle in each set. (F) GO terms of top 100 differentially expressed genes in each set. More GO terms are shown in S4 Table. (G) Expression of representative genes in each set along single-cell pseudotime trajectories. The sequencing data was deposited availably in GSE134339, and this figure can be produced using scripts at https://github.com/WangLab401/2020scRNA_murine_ovaries. GO, Gene Ontology.

