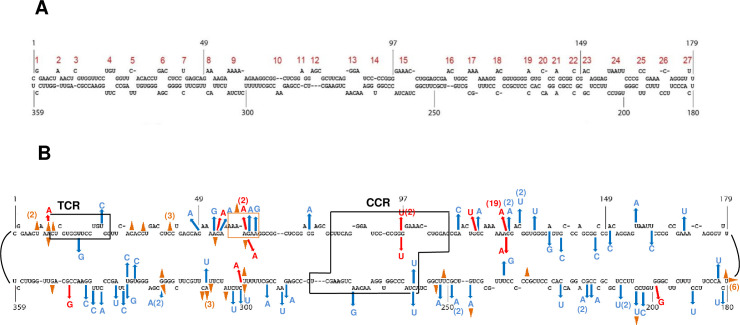
Fig 5. Comparison of mutations identified from PSTVd (-)-strand dimer sequencing and deep sequencing variant progeny.
(A) Secondary structure of the (+)-strand PSTVd genome. Nucleotide coordinates are indicated and loops/bulges are numbered 1 to 27 (red). (B) Mutations were mapped to genomic (+)-strand PSTVd. Mutations identified from dimer sequencing are indicated to the outside of the PSTVd secondary structure, and mutations identified by deep sequencing PSTVd progeny populations are indicated to the inside. Progeny mutations shown were shared by more than 10 unique sequences per million reads. Blue arrows indicate base substitutions, red arrows indicate base insertions, and brown triangles indicate base deletions. A deletion of seven consecutive bases is indicated by a brown box. Numbers of occurrences are indicated in parentheses. The terminal conserved region (TCR) and central conserved region (CCR) are outlined by black boxes.

