
Figure 5.
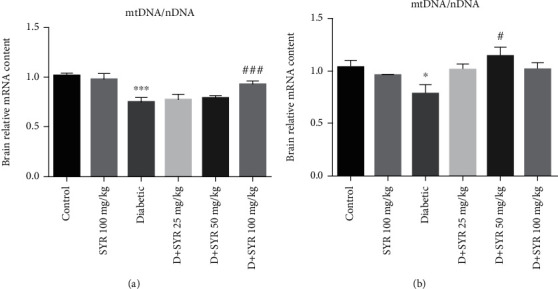
The effect of SYR on mitochondrial mass (mtDNA/nDNA) in the brain and spinal cord of streptozotocin- (STZ-) induced diabetic rats in various experimental groups. SYR: syringic acid. All values are expressed as mean ± SD; n = 4 per group. ∗p < 0.05, ∗∗∗p < 0.001 vs. the control group; #p < 0.05, ###p < 0.001 vs. the diabetic group.