Figure 2.

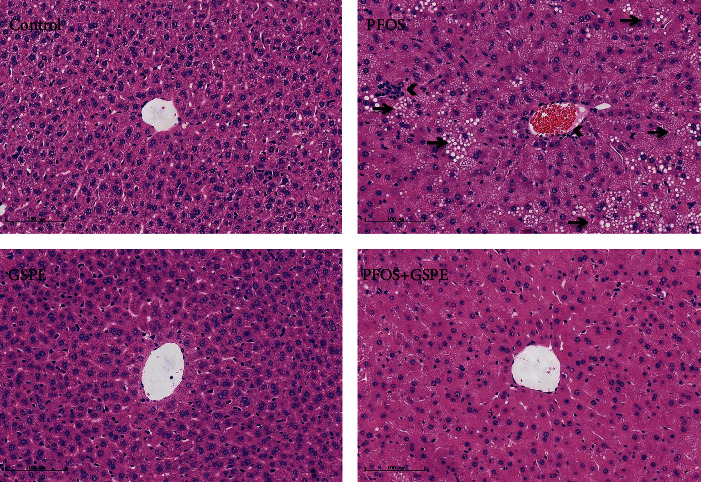
GSPE ameliorated PFOS-induced histological changes in the liver. Arrows indicate steatosis, and arrowheads indicate inflammatory cell infiltration. Scale bar: 100 μm. Magnification: 200x.

GSPE ameliorated PFOS-induced histological changes in the liver. Arrows indicate steatosis, and arrowheads indicate inflammatory cell infiltration. Scale bar: 100 μm. Magnification: 200x.