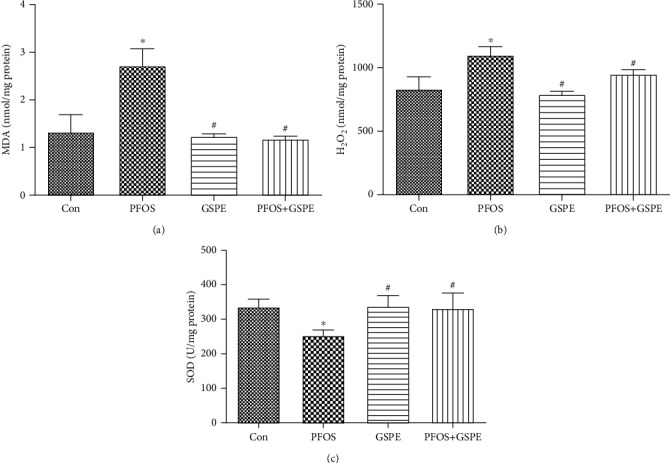
Figure 4.

Effects of GSPE on MDA, H2O2, and SOD levels in the liver of PFOS-treated mice. Values are mean ± SD. ∗P < 0.05 compared to the control group; #P < 0.05 compared to the PFOS group.

Effects of GSPE on MDA, H2O2, and SOD levels in the liver of PFOS-treated mice. Values are mean ± SD. ∗P < 0.05 compared to the control group; #P < 0.05 compared to the PFOS group.