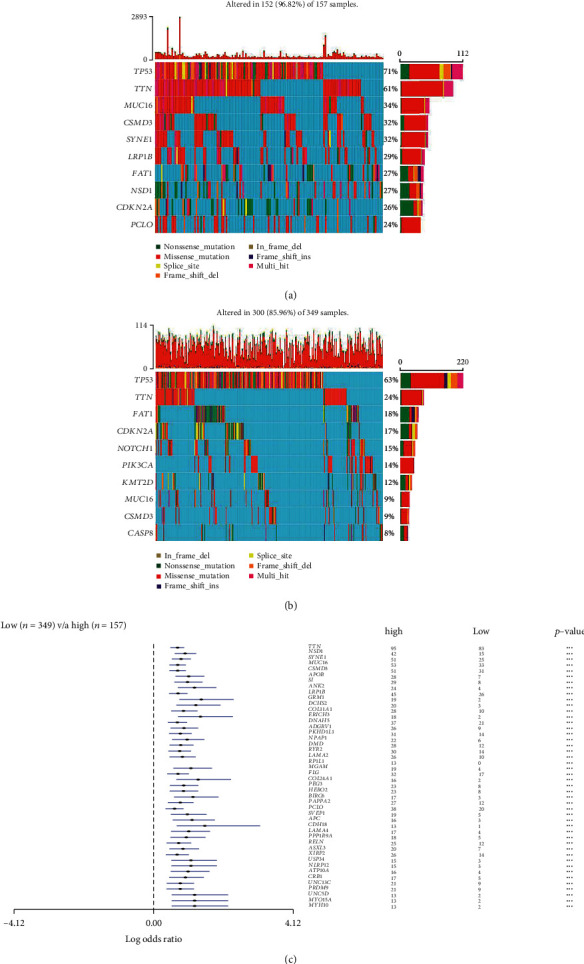
Figure 4.

Mutation analysis between the high TMB and low TMB groups in the TCGA dataset. (a, b) Gene mutation profiles of the following highly mutated genes among the two subtypes. (c) The forest plots show the comparison results of gene mutations (∗p = 0.1, ∗∗p = 0.05, ns: not significant).
